Data Center transient CFD simulation: Thermal Inertia Analysis
The High Cost of Cooling Gaps in Server Rooms
Every Facility Manager knows the nightmare. The power goes out, the UPS kicks in, and the servers stay on. But the chillers take time to restart. In that window, your server room turns into an oven. To manage this risk, Data Center transient CFD simulation is a vital tool. At Atreydes Engineering, with our extensive track record in mission-critical environments, we use this technology to transform uncertainty into precise operational data.
The doubt isn’t if it will heat up. The question is: exactly how much time do you have before automatic shutdown? At Atreydes Engineering, we stopped guessing. We use Data Center transient CFD simulation to clock real thermal inertia.
The Case Study: 100 Critical Seconds
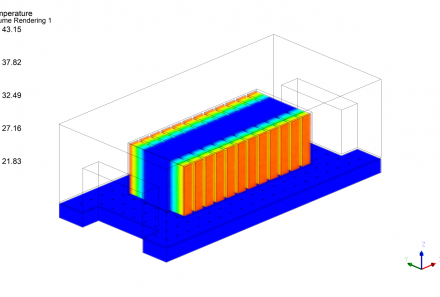
We recently validated safety for a High-Density room. We simulated total cooling failure. We shut down all CRAC units while IT load stayed at 100%. Results defied the client’s intuition.
What the Data Revealed: 32ºC in 100s
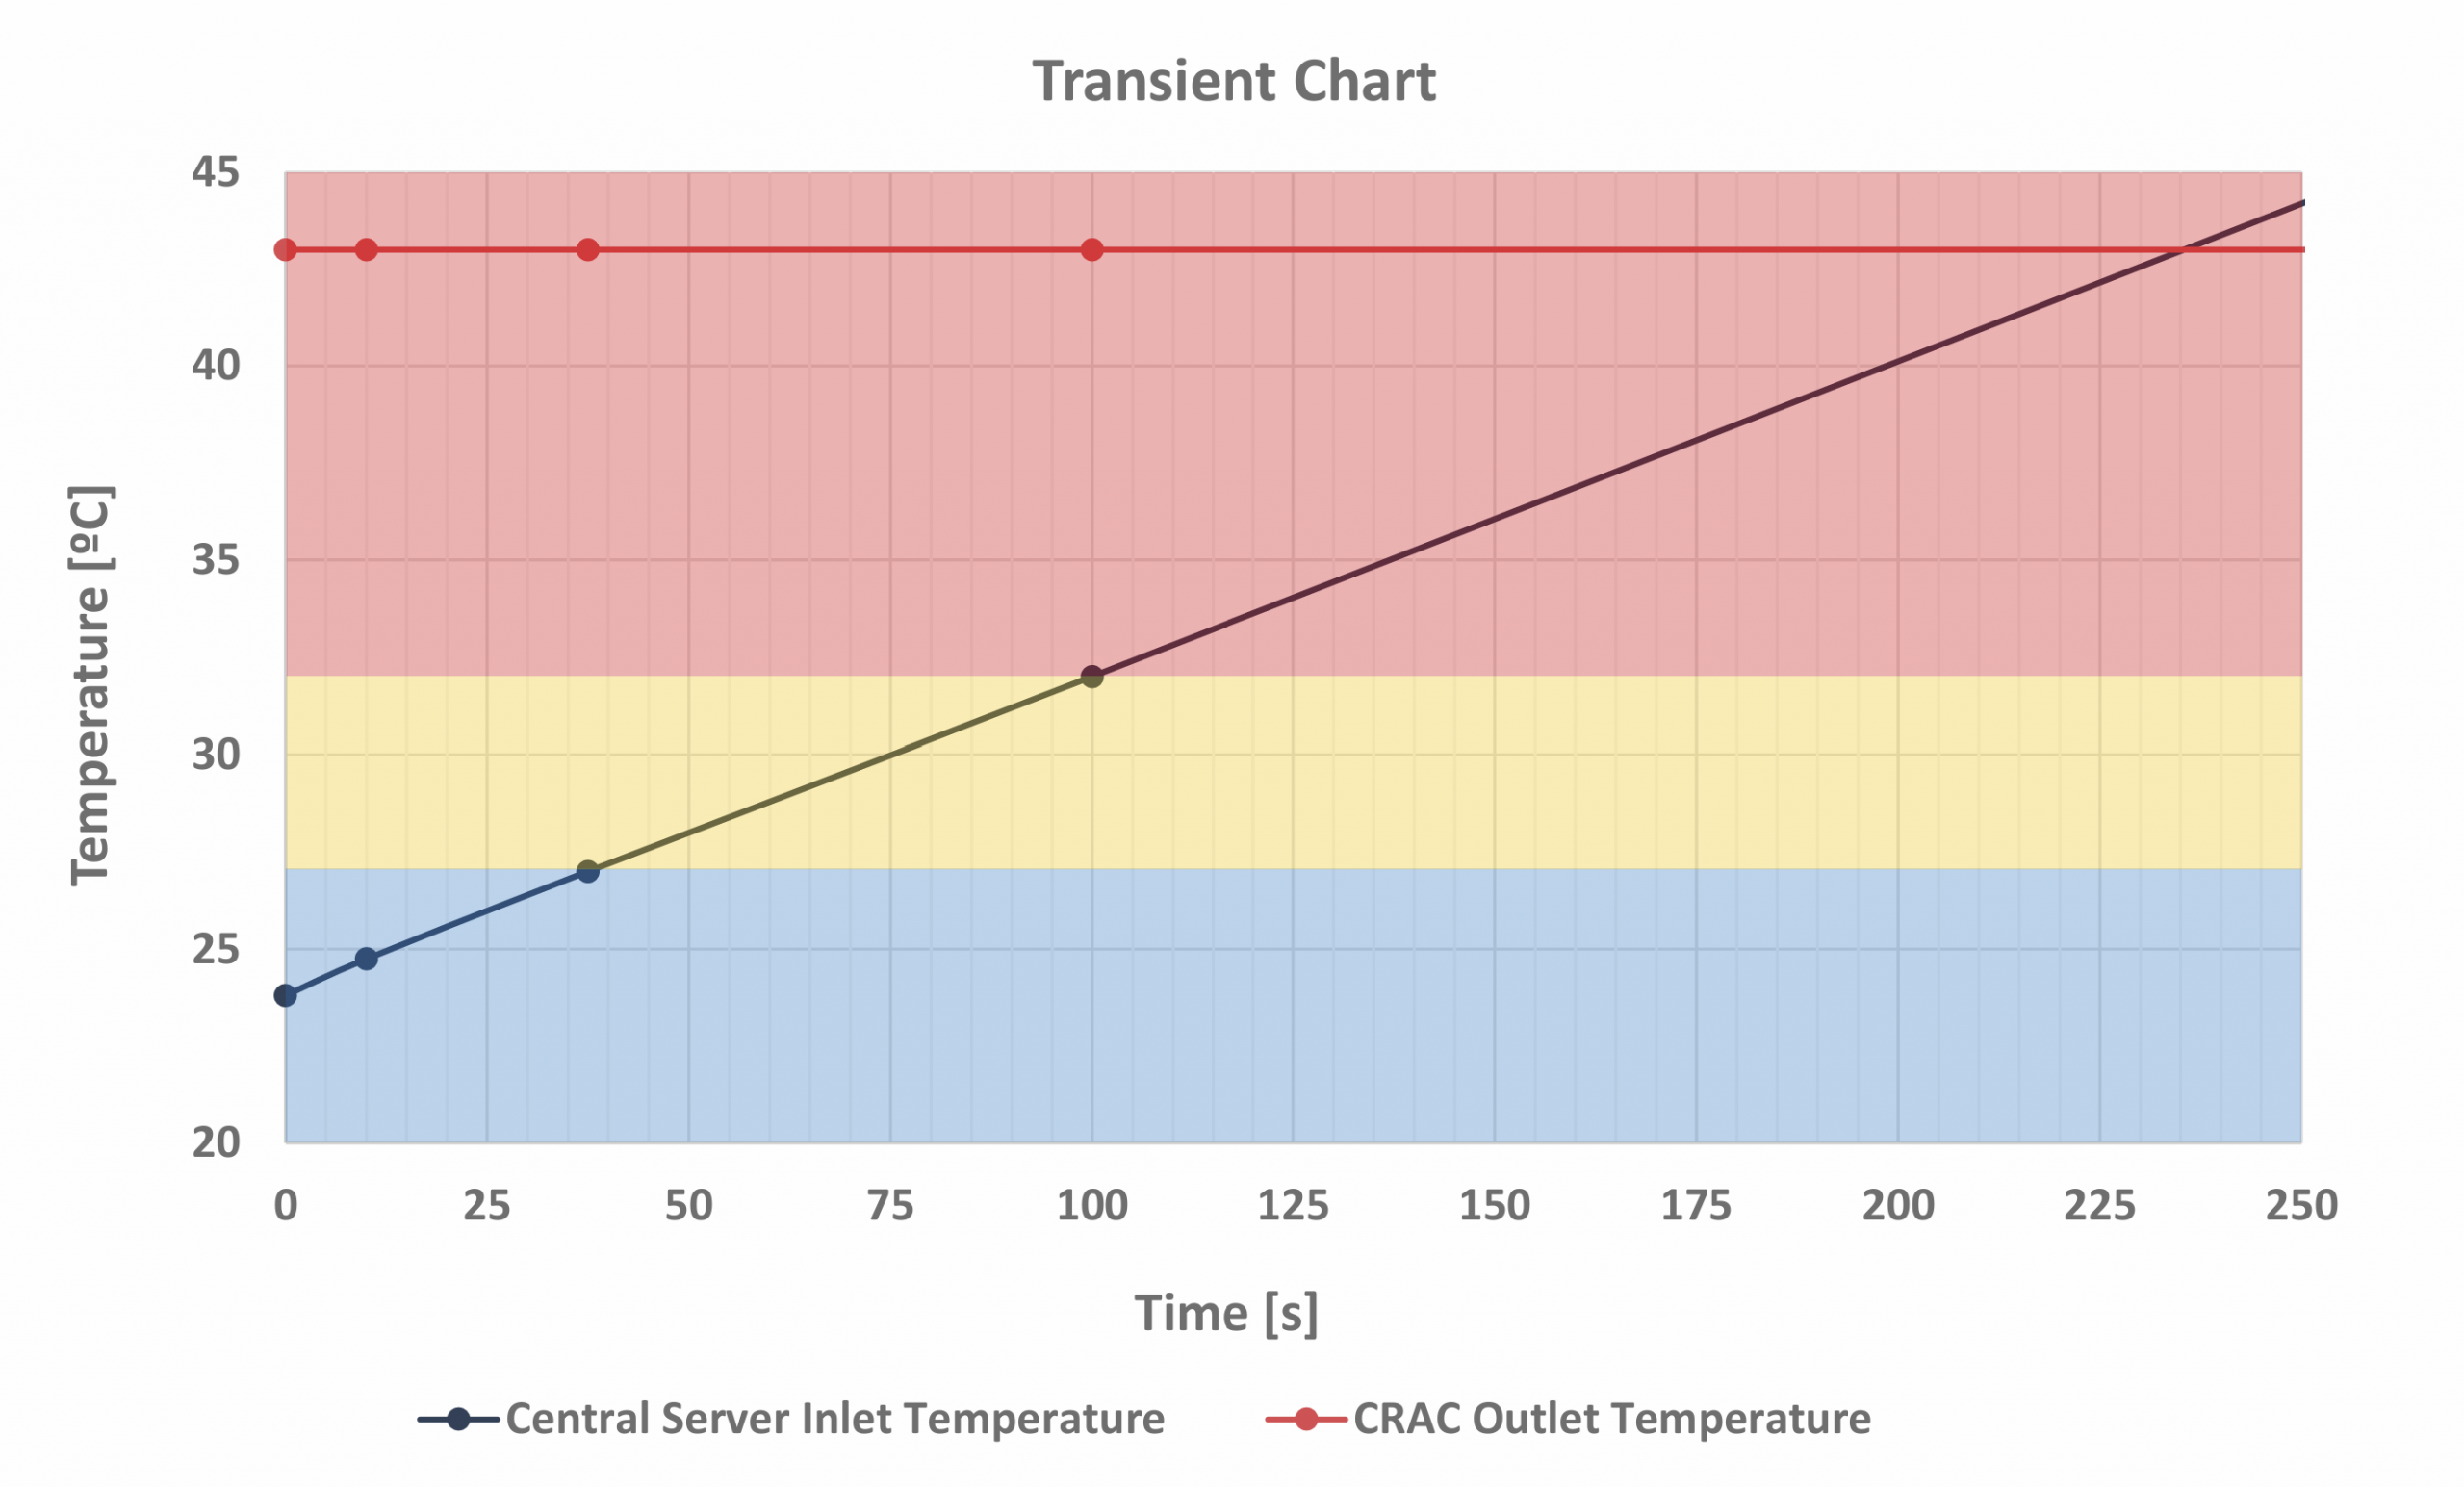
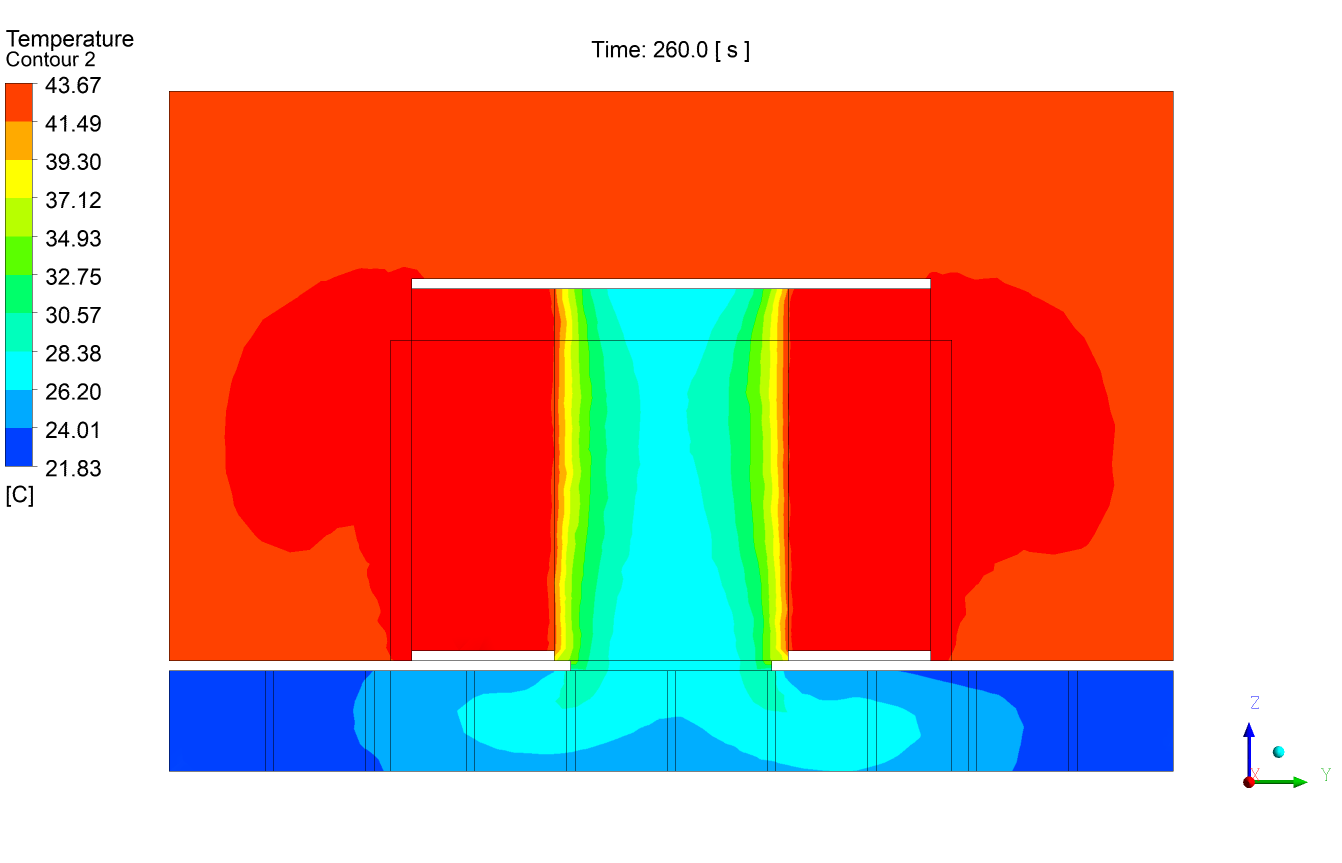
Many assume that temperature spikes instantly. However, our Data Center transient CFD simulation detected linear behavior at the start.
-
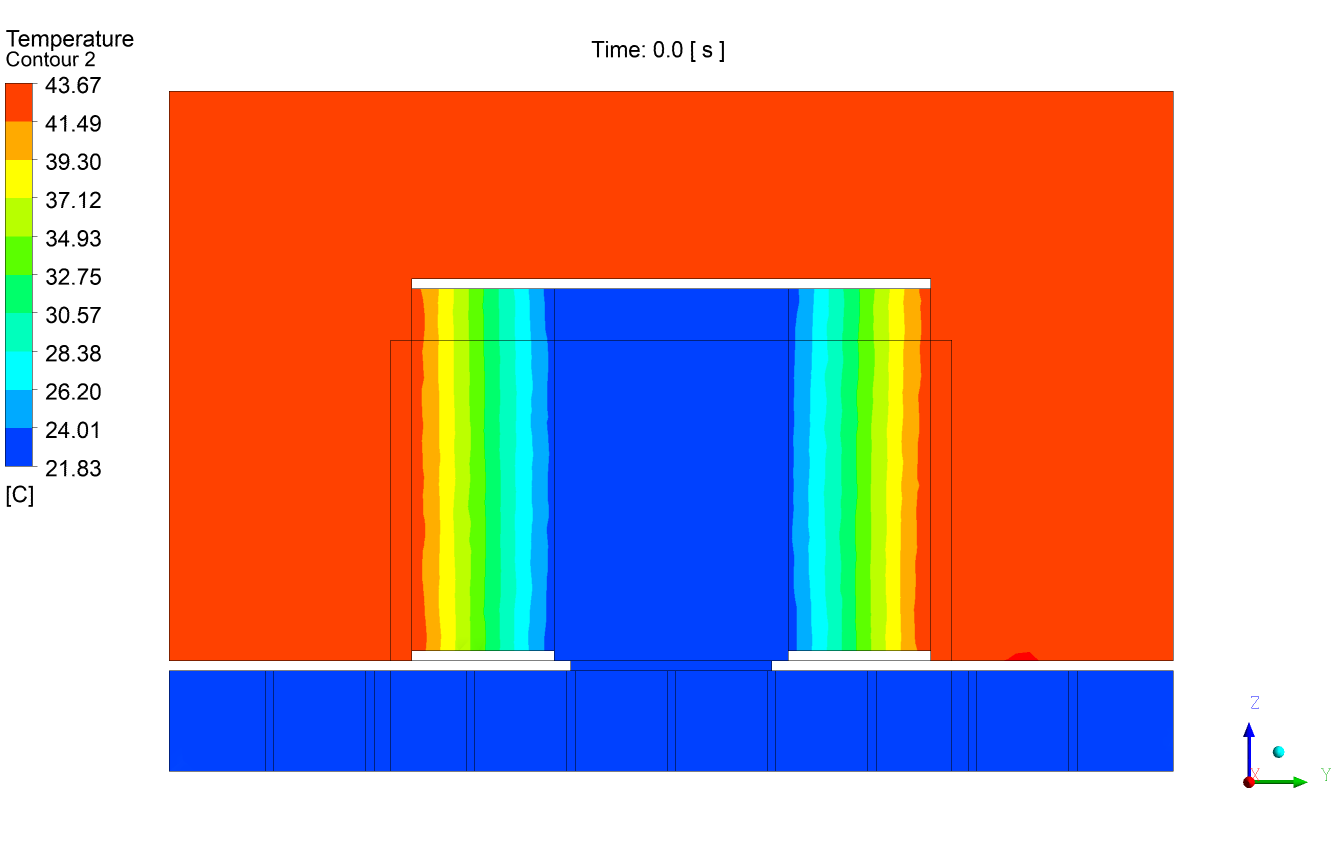
t=0s: System operates stably at 22°C.
-
t=10s to 37.5s: Air recirculates without cooling. Air volume acts as a buffer.
-
t=37.5: Intake temperature crosses the 27°C safety threshold for central servers.
-
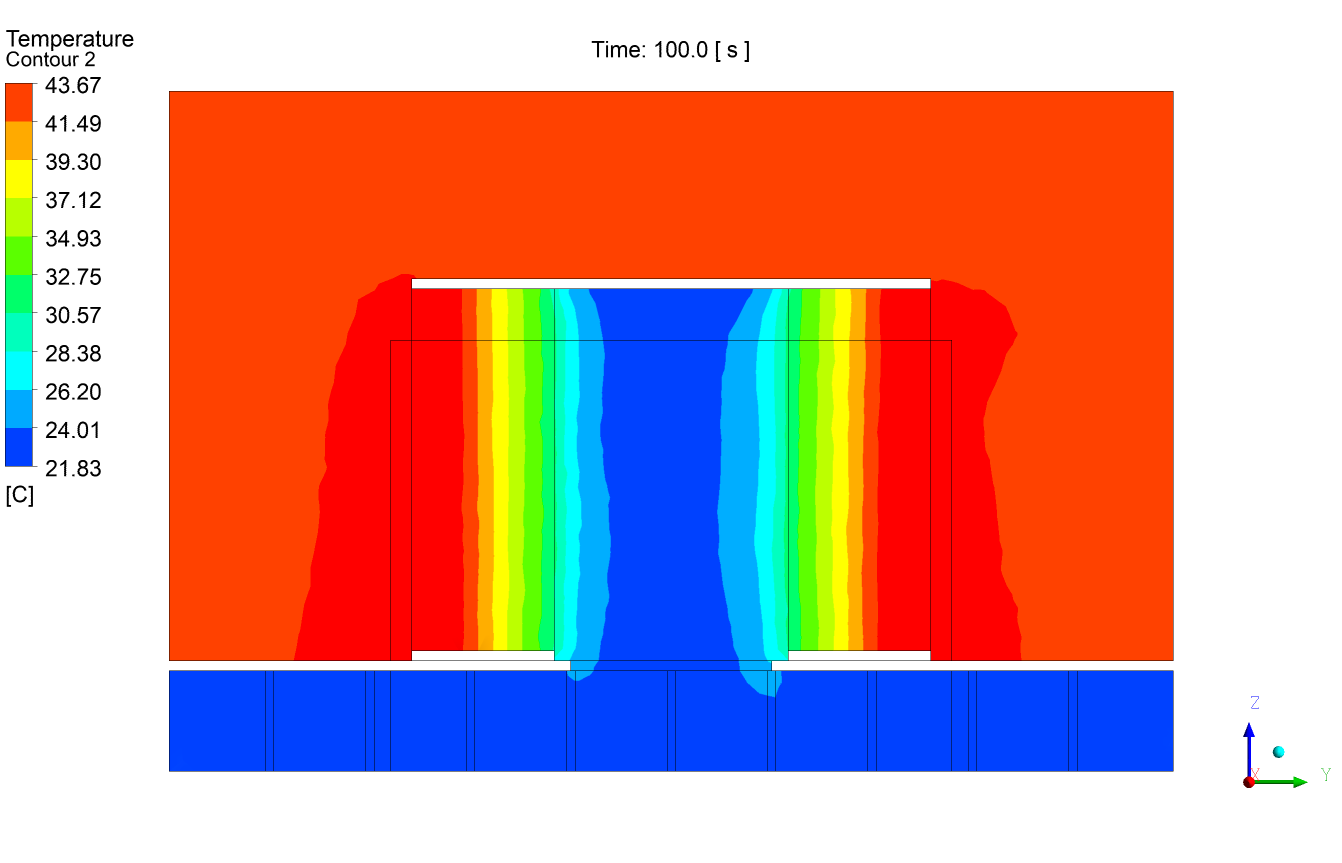
t=100s: Intake temperature crosses the 32°C barrier.
What Does This Mean for the Client?
32°C is the ASHRAE A1 limit. Performance degrades from second 100. With this data, cooling generators were adjusted. They now start at second 45. This ensures a 55% safety margin.
Why Spreadsheets Don't Work Here
A spreadsheet cannot see heat accumulation. Only a Data Center transient CFD simulation reveals those hidden hot spots.
In our High-Density Data Center Thermal Validation using CFD (Computational Fluid Dynamics), we analyzed steady-state behavior to optimize design. However, only transient analysis predicts disaster evolution second by second. Steady-state shows if the design is efficient. Transient analysis tells you when it will fail during a shutdown.
Want to Deepen Your Thermal Design?
This transient analysis measures failure response time. But ensuring daily efficiency is vital first. We recommend reading our High-Density Data Center Thermal Validation using CFD. There, we explain how steady-state analysis optimizes airflow and reduces costs before emergencies occur.
Conclusion: Buy Time, Not Just Hardware
Ride-through time is a valuable asset. Knowing it to the second lets you sleep soundly. Do you know how long your infrastructure lasts without air? At Atreydes Engineering, we calculate it before disaster strikes.
Related posts
Projects


About Us