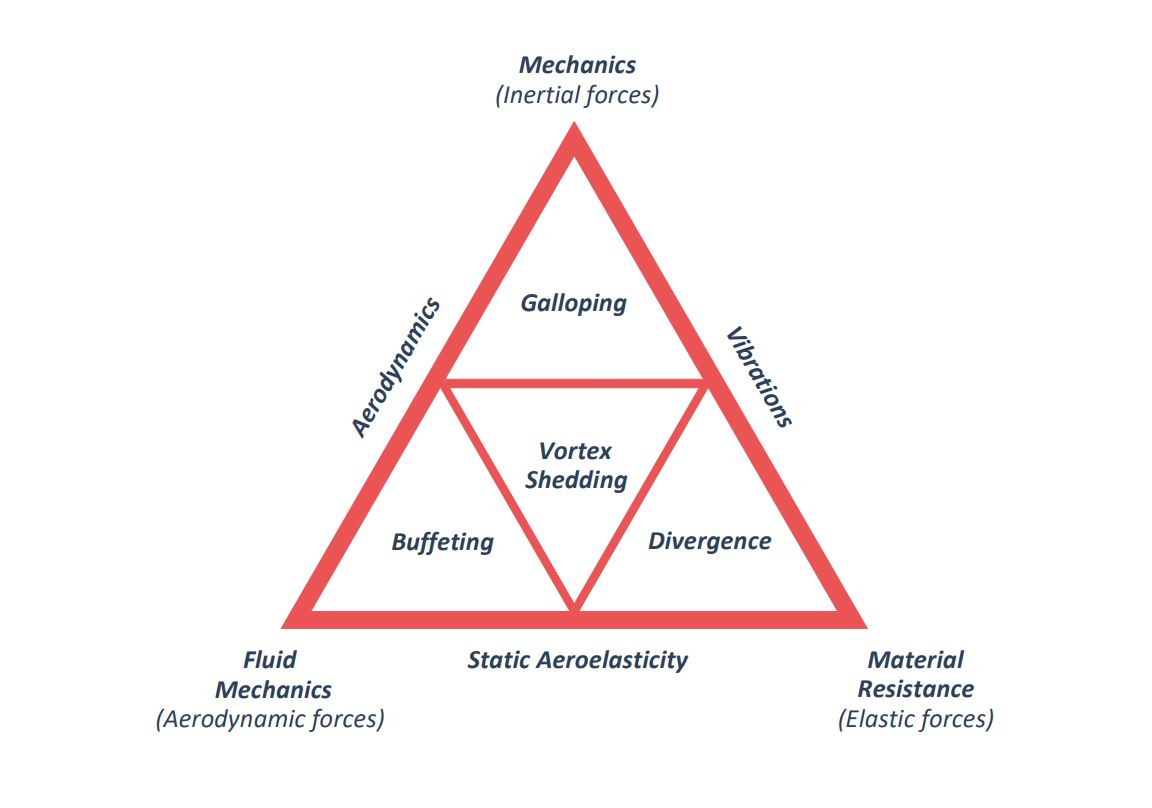
Buffeting on solar trackers
Buffeting on solar trackers is the vibration produced by turbulence or other disturbances of the flow not produced by the obstacle that suffers them.
Two types of buffeting on solar trackers can be distinguished:
Buffeting on solar trackers is due to changes in wind pressure on the structure because of turbulence. This causes the wind speed to oscillate around an average speed (V1h), reaching positive peaks (V3s) and negative peaks around this average speed, giving rise to speeds to be considered in the building codes.
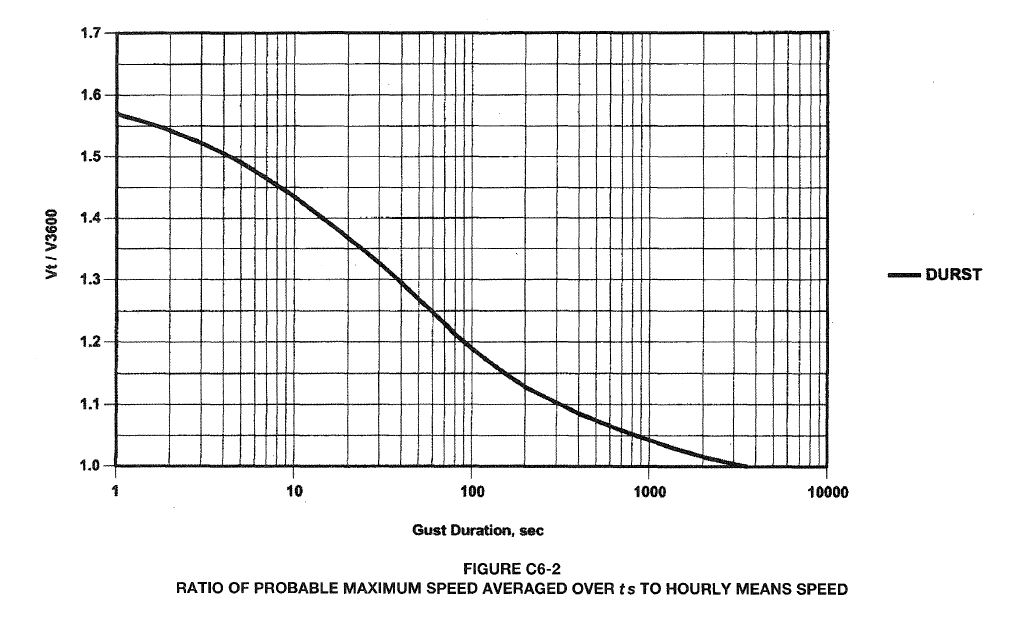
Buffeting introduces instantaneous pressure increases on the structure. As we can see in the graph above, the maximum ratio between these speeds is 1.52, but at each point on the structure there will be a value between -1.52 and 1.52 at random. What can be confirmed is that, if there is a defined configuration of pressure points on the tracker surface at a given instant, this same configuration can be repeated randomly over time.
Technical codes consider this peak speed for all structure sections, but in reality, and due to the length of the tracker, they only occur in certain areas and never at the same time over the entire surface. That is why building standards are always on the safety side and that is why wind tunnel tests better adjust the real load on structures by considering only the maximum configurations of these peak pressures that occur in real situations.
Since we do not have wind tunnel tests, we will define an average gust parameter ( \bar G ) to be used to increase the torsional moments produced by the vortex shedding to take into account this phenomenon.
\bar G = \Large \frac{1 + 1.52}{2} \normalsize = 1.26
This parameter that increases wind loads due to turbulence should not be applied to tracker rows that are totally immersed in the wake of contiguous trackers, as occurs in the more vertical tracker tilts [-60º, 40º] and [40º, 60º], since they will never see such turbulence, only the wake of the adjacent tracker.
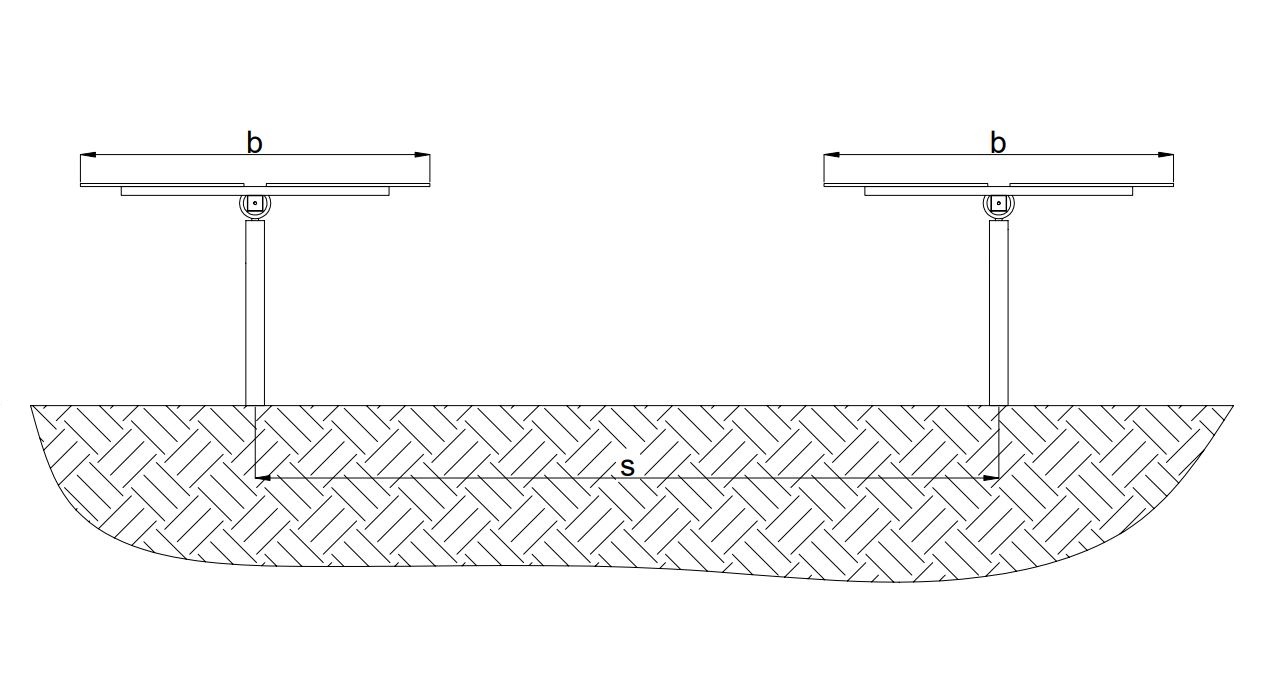
Before dealing with wake buffeting, it is necessary to introduce the concept of Ground Coverage Ratio (GCR). The GCR is a coefficient that measures the percentage of trackers covering the plant ground in horizontal projection, so it will be defined as the ratio between the width of the tracker section (b) and the distance, among pillars, that separate the rows of trackers which form the plant (s).
GCR = \Large \frac{b}{s}
The GCR values range in the interval [0, 1]. It is zero when the tracker separation (s) is infinite and 1 when this distance (s) is equal to the tracker section width (b). These limiting values are not realistic. The first one, with a value of zero, because you could never configure a plant. The second one, with a value of 1, because the losses due to shadows between tracker rows are very high and unacceptable, so an intermediate value between both is taken. Values of s less than b are not possible, because there would be interferences between the tracker rows.
This parameter has a significant influence on the shading between tracker rows. The standard configuration of a plant is usually a north-south layout of the tracker rotation axis, so the east-west shadows, those occurring at sunrise and sunset, will be the ones that produce energy losses, since the trackers are in very vertical tilts to try to see the sun, ±60º.
If we study the theoretical cases of sunrise and sunset, solar elevation 0º, the trackers would have to be positioned with a tilt of ±90º to optimize energy production. Since the solar energy at these times is small, the tracker amplitude of motion is trimmed to the interval [-60º, 60º], measured from the normal, and the loss of these times is assumed, commonly called the cosine effect because it can be computed as the cosine of the angle formed by the normal of the tracker tilt and the direction of the solar ray. It is a loss due to the limitation of the tracker motion.
Due to the high tracker tilts, shading between rows must be taken into account. The greater the separation (s), the lower the shading losses. Backtracking maneuvers are often used in which the tracker tilt is lowered at certain times of sunrise and sunset to reduce shading between trackers and thus increase the GCR, assuming cosine effect losses in these backtracking positions.
Therefore, GCR is a parameter that should be increased as much as possible in order to install more trackers in a given area of land and, on the other hand, its value should be reduced so that the shadows between trackers do not cause significant losses in the plant.
For practical purposes, GCR values are usually in the range [0.45, 0.55], depending on the plant ground availability.
The parameter GCR also influences the wake buffeting, since the vortices propagate between the rows of trackers depending on the tilts of trackers. The lower the GCR and, therefore, the greater the separation between trackers, the lesser the effects these vortices will have on the trackers, since they have a greater distance to dissipate their energy.
A tracker separation (s) of 10m, with a GCR of 0.47, has been chosen for the wake buffeting analysis.
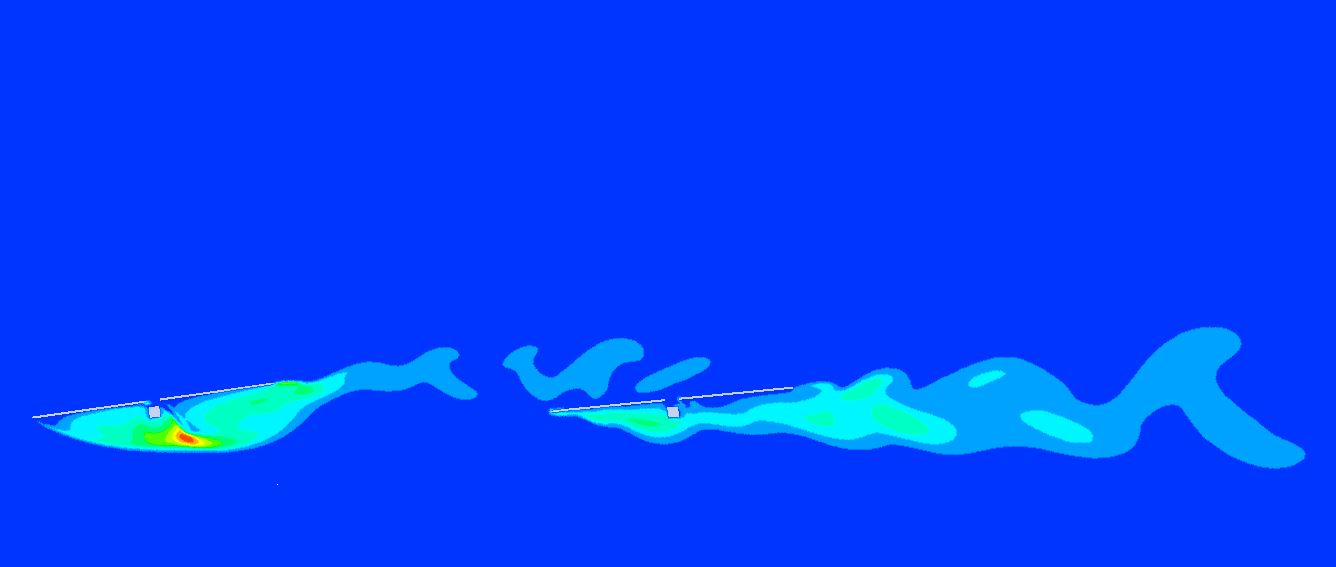
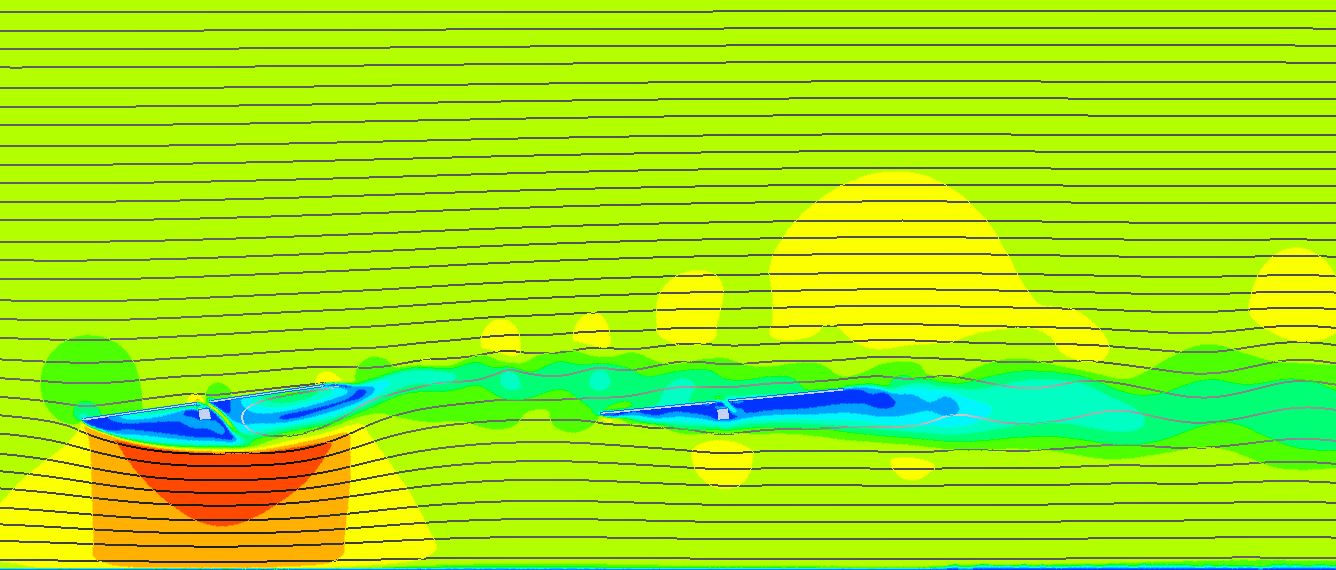
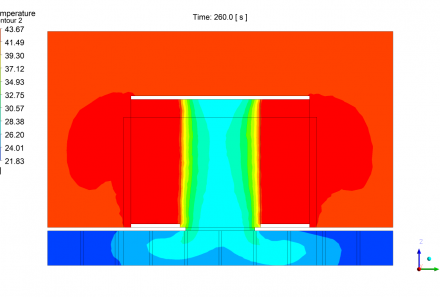
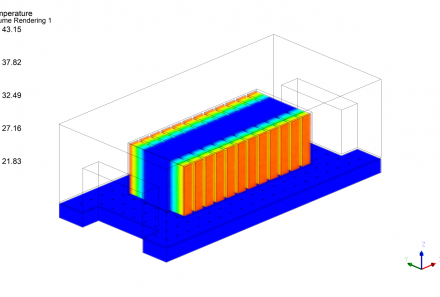
In contrast, wake buffeting affects only internal trackers in the plant and is an instability due to pressure changes in the wind that causes the vortex shedding from a structure that is between the wind flow and the design structure.
It is, therefore, a second resonance problem, since if the vortex shedding causes an oscillation on the structure it leaves, it will also cause an oscillation on the next structure it hits, given that both structures are identical and have the same natural frequency.
As a result, a vibration of amplitude and frequency will appear, a priori, different from those of the tracker facing the totally clean wind flow, so each row of trackers should be checked to see if there are significant modifications with respect to the perimeter row that change the tracker design.
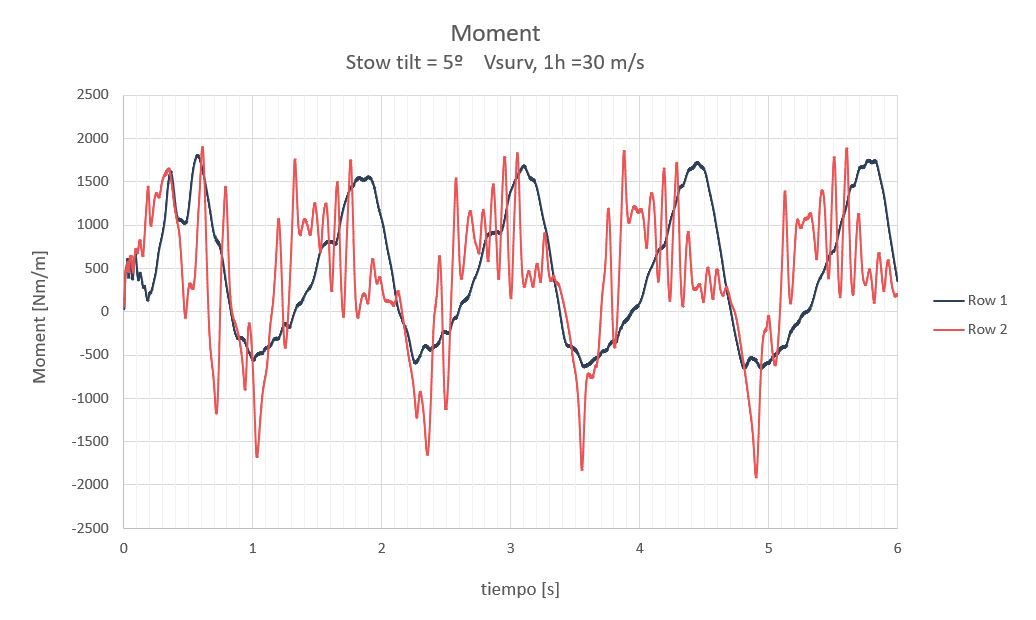
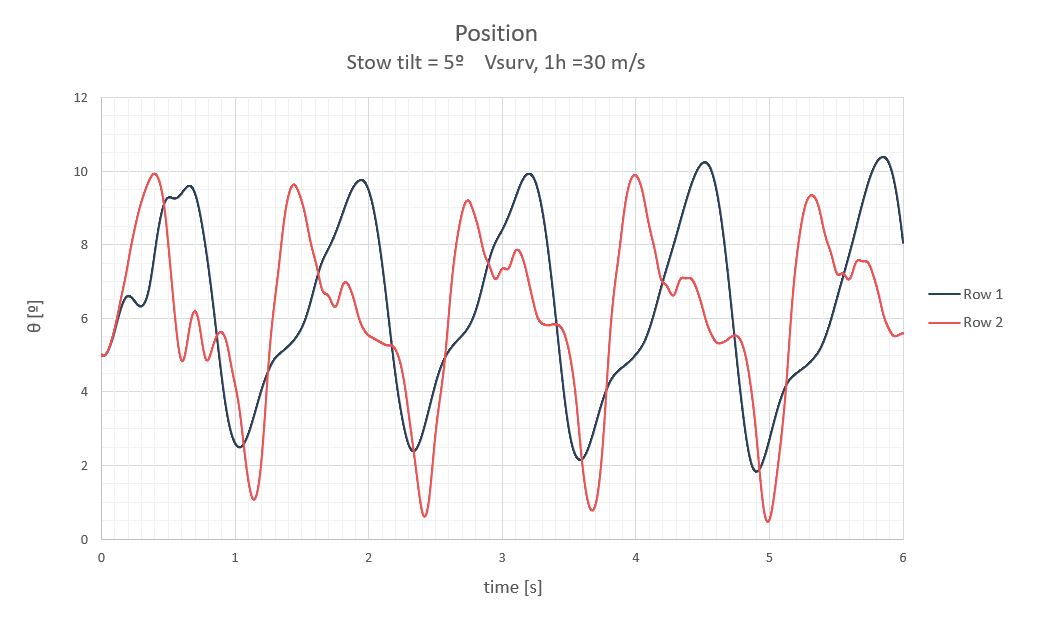
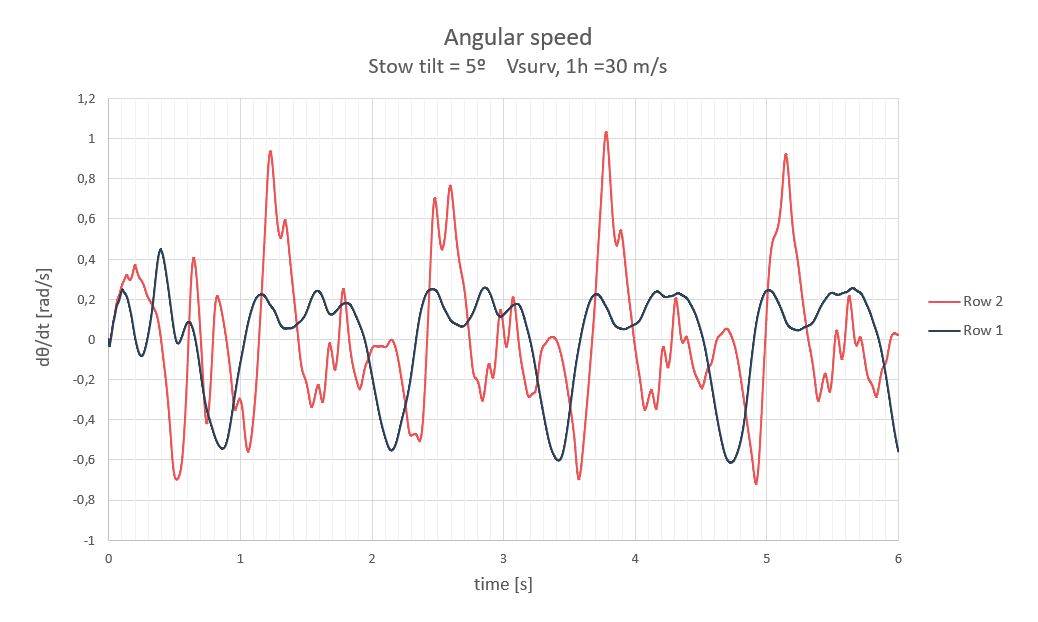
It has been studied how the last section twist varies, as well as the moments produced by the wind in two rows after the perimeter one for stow position (5º) at survival speed ( V_{surv,1h} = 30m/s ), since the wind generates the largest torsional moments that define the torque tube and the drive system static limit as well as the largest twists of the tracker sections.
The results together with some conclusions are presented below:
| Type | T [s] | f [Hz] | Mest [Nm/m] | Ma [Nm/m] | Mmax [Nm/m] | Δθest [º] | Δθa [º] | Δθmax [º] |
|---|---|---|---|---|---|---|---|---|
| Isolated | 1.16 | 0.86 | 568 | ±883 | 1450 | 1.58 | ±2.87 | 4.45 |
| Row 1 | 1.33 | 0.75 | 546 | ±1152 | 1698 | 1.52 | ±3.61 | 5.13 |
| Row 2 | 1.35 | 0.74 | 1630 | ±1858 | 1858 | 0 | ±5.80 | 5.80 |
- If we compare the first row of trackers in a plant and an isolated tracker, the results are very similar. The natural frequency is reduced by about 15%, the moments increase around another 15% as well as the maximum twist angles of the last tracker section. This difference may be due to the fact that the wake no longer has enough space to fully extend, causing disturbances on the tracker that produces it.
- A tracker just downstream of a perimeter tracker receives a wind disturbed by the wake of the preceding tracker, receiving much more chaotic moments, but with a defined harmonic pattern. The frequency of occurrence of this set of harmonics is the same as for the perimeter tracker, but the moments and rotation of the tracker increases by another 15% with respect to the preceding perimeter tracker, 30% with respect to the isolated one.
These values achieved in the wake buffeting are specific to a tracker defined with very specific natural frequency (n), damping (ξ) and GCR parameters, so if the tracker characteristics change, the results obtained in the wake buffeting analysis may change as well.
Summary
Buffeting on solar trackers increases the incident moments both in the perimeter trackers due to wind turbulence and in the interior ones due to the wake produced by the preceding trackers.
Related posts
Projects


About us