Aeroelastic solar tracker design
In this post, we will analyze the parameters involved in aeroelastic solar tracker design. We will study a tracker with 30 PV modules on each side of the drive system arranged in 2 rows and with a length of 17.3 meters per arm (35 meters total tracker), in order not to present aeroelastic instabilities for the different wind speeds which can appear in a photovoltaic plant.
Single-axis trackers with a single row of modules are much more stable since they have a section length (b) of around 2.5m (the module length). Increasing this parameter has a negative influence on the tracker stability if we are studying its aeroelastic performance. As an example, the moments obtained act with the square of this parameter and the galloping is cubed.
The solar market tends to move towards a double row configuration, but if you come from the installation of trackers with a single row of modules, you will have to make the necessary modifications to avoid aeroelastic phenomena due to the increase of the tracker section width.
Tracker geometry
We will analyze a single-axis solar tracker carrying 30 modules arranged in two rows per torque tube (60 total modules per tracker) on each side of the central drive system. The rows are spaced 140mm apart.
The module dimensions that we have taken into account are 1130 x 2250 mm, so the area on each side of the mechanism is 17.3 x 4.7m.
The torque tube has a thin-walled square section of #140.5 mm and a length of 17.3 m as mentioned above. The modules are separated from the torque tube by means of the profiles that carry it at a distance of 120 mm.
Design speeds
For aeroelastic solar tracker design in a photovoltaic plant, there are 2 important speeds to take into account in the design of trackers:
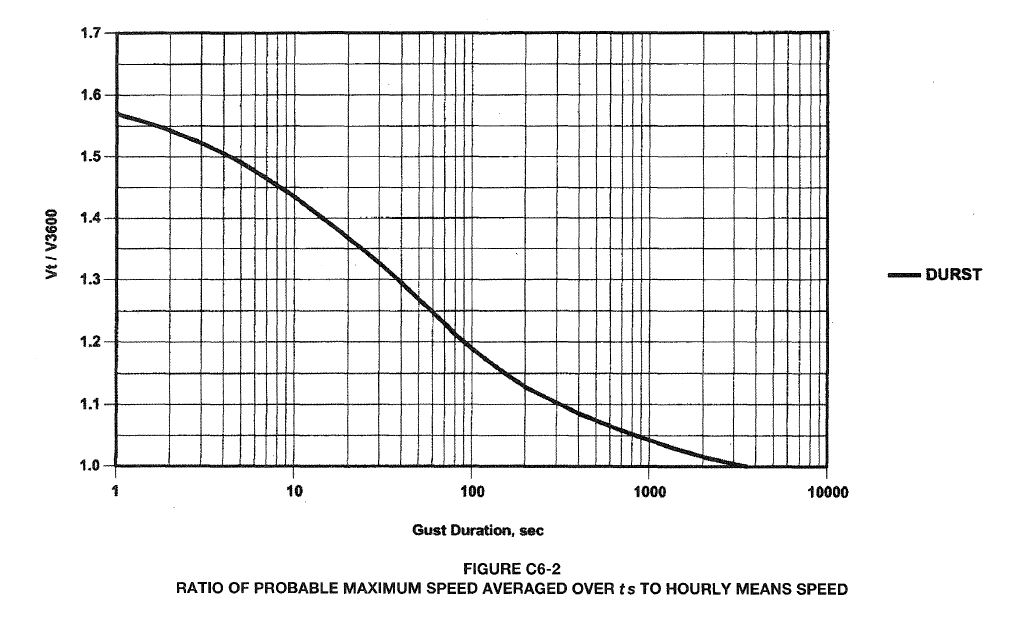
The critical speeds that assess the occurrence of the twin aeroelastic phenomena (galloping and divergence) are average or hourly speeds ( V_{1h} ). However, the plant-defining velocities are peak speeds ( V_{3s} ) and are usually taken from building codes that may or may not include a safety coefficient, usually around \sqrt{1.6} . The relation between the average velocity and its maximum peak is probabilistically measured by means of the following graph, so:
\Large \frac{V_{3s}}{V_{1h}} \normalsize = 1.52
We make this speed distinction because building codes usually work with peak speeds ( V_{3s} ), while simulation programs and wind tunnels work with average speeds ( V_{1h} ). The reference height for these velocities is always taken at 10m.
For this analysis, the following design velocities will be used, which are usual in most solar photovoltaic plants:
| V1h [m/s] | V3s [m/s] | |
|---|---|---|
| Vsurv | 30 | 45 |
| Vstow | 10 | 15 |
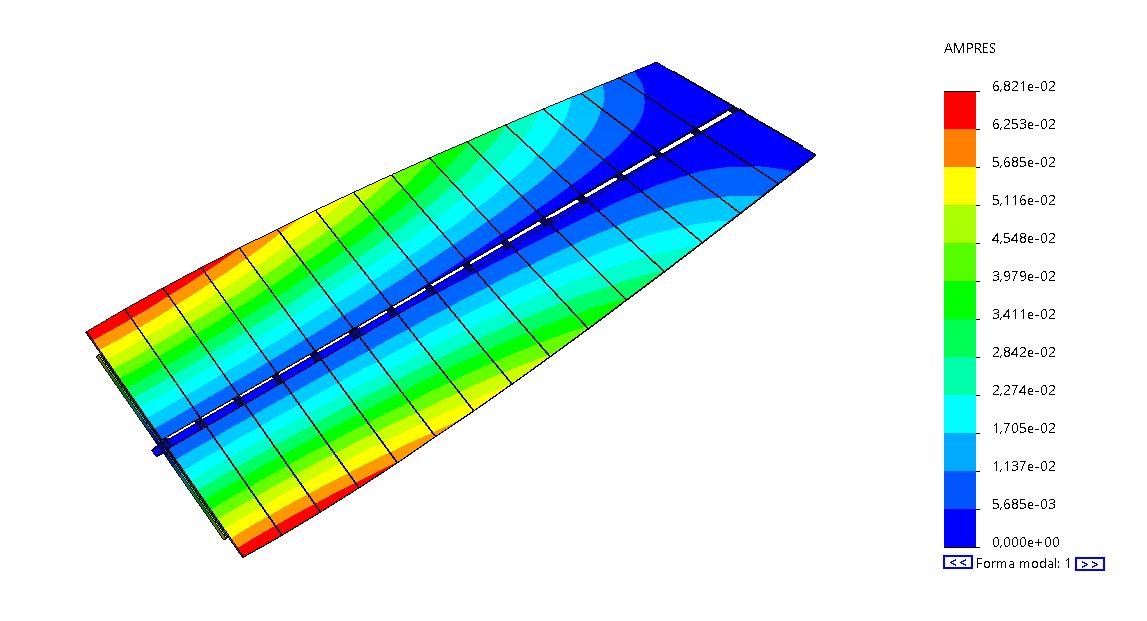
Mode of vibration
In aeroelasticity of solar trackers, it is essential to take into account the frequency and the mode of vibration at different wind speeds faced by the photovoltaic plant.
From here on, we will refer to the tracker as each of the parts on either side of the central drive, since both deform independently.
For the two-row half of the tracker, the first torsional mode of vibration occurs at a frequency (n) of 1.2 Hz.
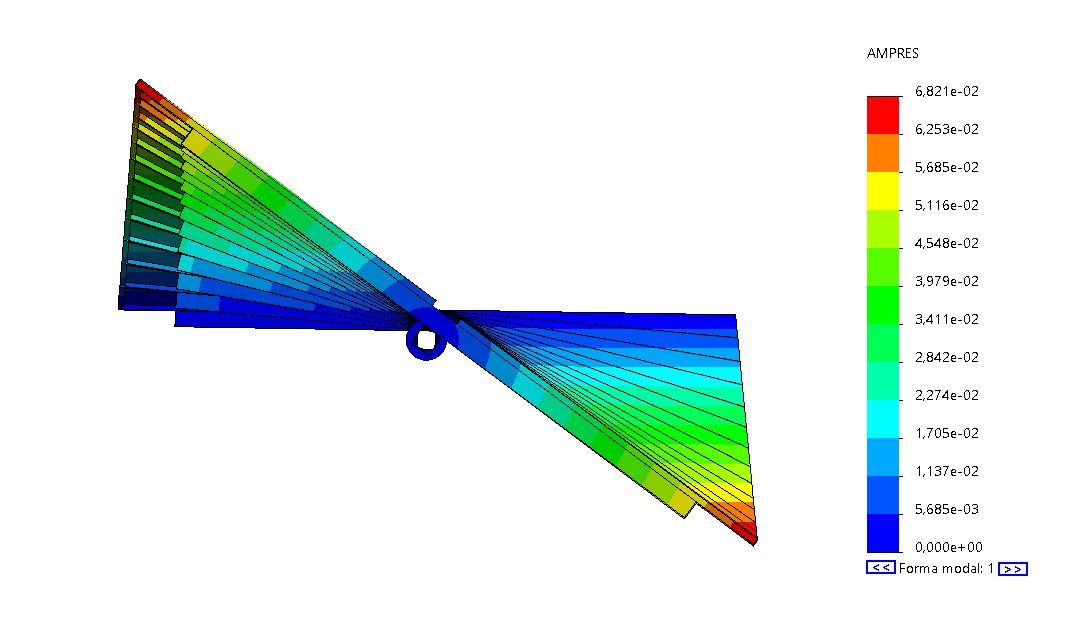
For simplicity, we will adjust the three-dimensional model to a two-dimensional one with an equivalent inertia (I) and an equivalent stiffness (k) giving the same deformations as the last section in a three-dimensional model for the same state of equivalent loads. For practical purposes, we will assume that the entire tracker deflects and suffers the moments of the section furthest from the drive system. This assumption is on the safety side.
For the described tracker, we have the following values:
- n = 1.2 Hz
- I = 105 kg/m²
- k = 5969 Nm/rad
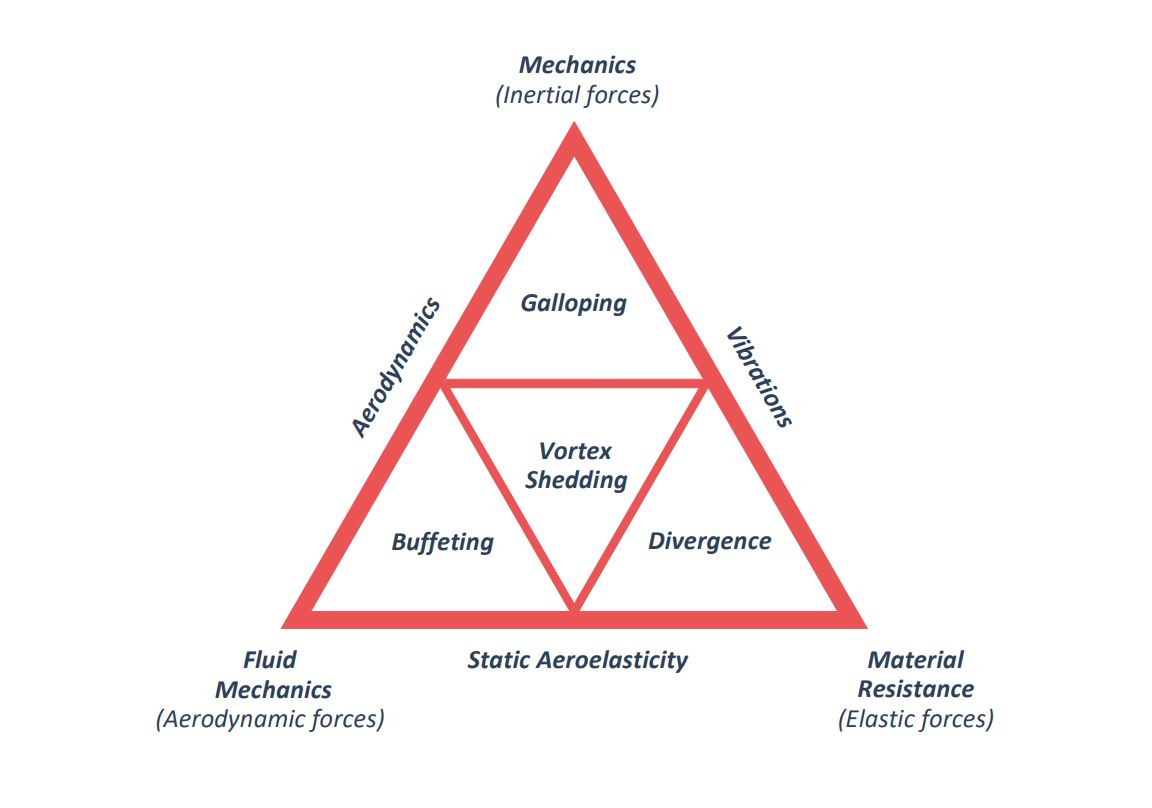
Aeroelasticity of trackers
Twin Inestabilities
In aeroelastic solar tracker design, torsional divergence appears at a wind speed whose moment coefficient nullifies the system stiffness (k). If the load on the tracker is reduced to its center of pressures, the divergence critical speed is:
U_{cr}|_{div} = \Large \sqrt {\frac {2k_{\theta}}{\rho b^2 \frac{ \partial c_m}{\partial \alpha}}}
Con:
- Ucr = 30 m/s
- b = 4.7 m
- ρ = 1.225 kg/m³
- \Large \frac{ \partial c_m}{\partial \alpha} ≈ 1.6 estimated with Eurocode annex.
And isolating k, we obtain the minimum stiffness so that torsional divergence is not reached before the plant survival speed:
k = \Large \frac {1}{2} \normalsize \rho U_{cr}^2 b^2 \Large \frac{ \partial c_m}{\partial \alpha} \normalsize = \Large \frac {1}{2} \normalsize 1.225 · 30^2 · 4.7^2 · 1.6 = 19483 Nm/rad
Since the tracker stiffness is lower than the calculated one, the tracker will reach torsional divergence at a lower speed than the survival speed, so this situation is unacceptable.
In this case it is necessary to increase the tracker stiffness to at least 19483 Nm/rad, so that aeroelastic phenomena due to torsional divergence do not appear. In a single-axis tracker the element that supports the torsion is the torque tube, currently defined at #140.5mm. To increase the stiffness, it is necessary to increase the tube side up to 210mm, keeping the same wall thickness. For this case, a new stiffness of 20559 Nm/rad would be obtained, above the calculated one.
This new stiffness provides a new natural frequency to the system (n) of 2.1Hz which will positively influence the instabilities of torsional galloping and vortex shedding.
As can be seen, the increase of the tracker section (b) has to be compensated by an increase of the stiffness to keep the tracker stable against torsional divergence.
In aeroelastic solar tracker design, torsional galloping appears at a wind speed whose coefficient of moments nullifies the system damping (ξ). If the load on the tracker is reduced to the center of pressures, the galloping critical speed is:
U_{cr}|_{gal} = \Large \frac {4 I_{\theta} \omega_n \xi} {\rho b_c^2 r \frac{\partial c_m}{\partial \alpha}}
With:
- I = 115 kg/m²
- n =2.1 Hz
- \omega_n = 2 \pi n
- ρ = 1.225 kg/m³
- b = 4.7 m
- r ≈ b/4
- \Large \frac{ \partial c_m}{\partial \alpha} ≈ 1.6 aproximado con el anexo del Eurocódigo.
And isolating ξ, we obtain the minimum damping coefficient so that torsional galloping is not reached before survival speed.
\xi = \Large \frac {1}{16} \frac {\rho U_{cr}^2 b^3 \frac{\partial c_m}{\partial \alpha}}{I \omega_n} \normalsize = \Large \frac {1}{16} \frac {1.225 · 30^2 · 4.7^3 · 1.6}{115 · 2\pi · 2.1} \normalsize = 0.25
If the tracker damping is equal to or greater than 0.25, it does not come into galloping before the plant survival speed. This implies having a physical damping system on the tracker to achieve this value, since by itself, the tracker structure has a very low damping coefficient, around 0.01.
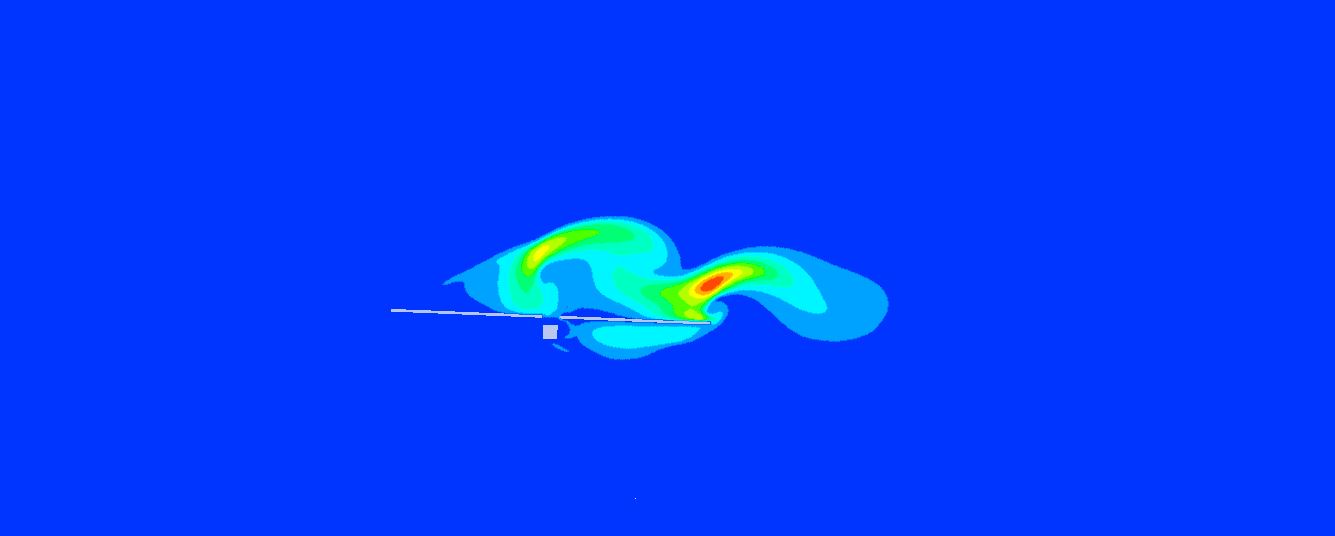
Vortex shedding
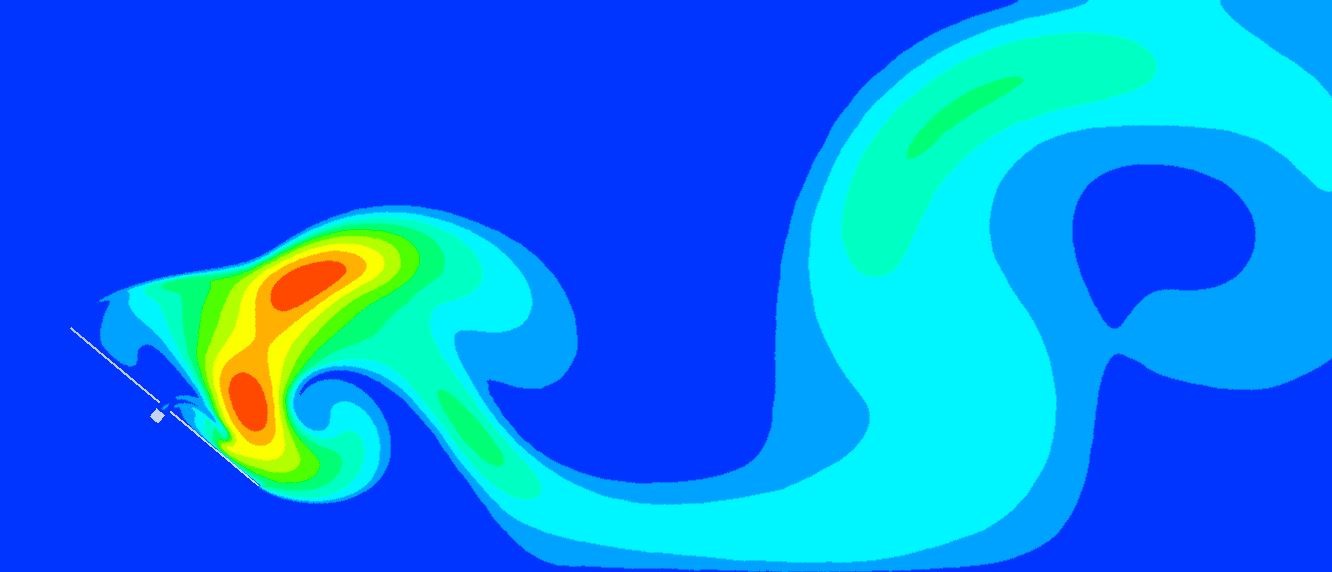
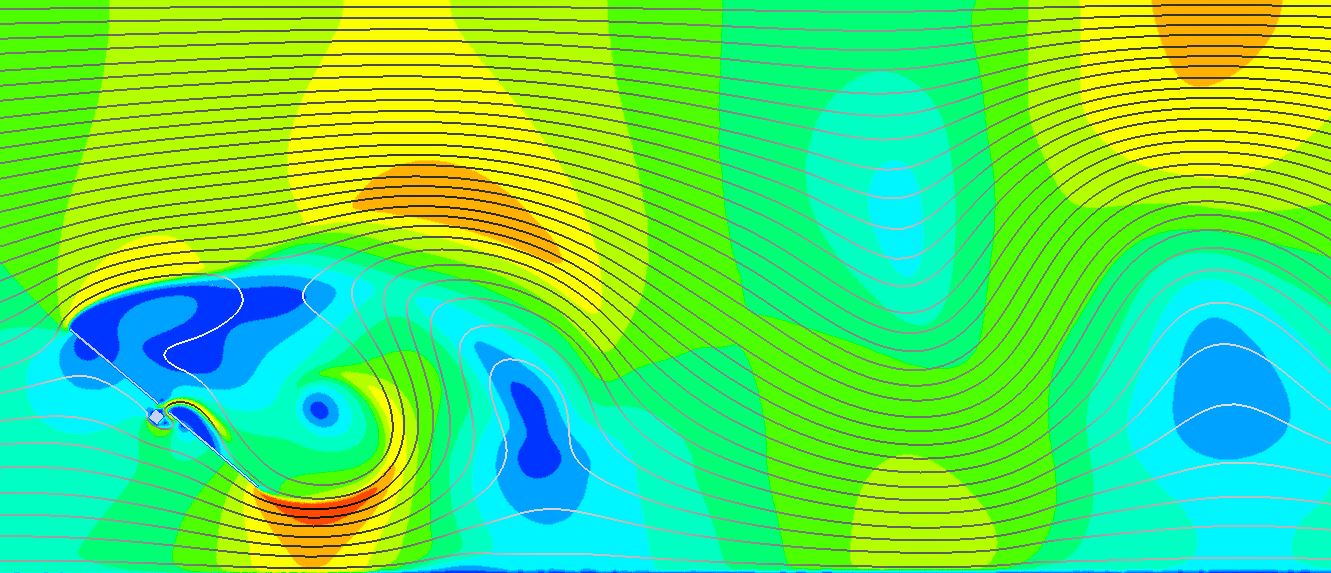
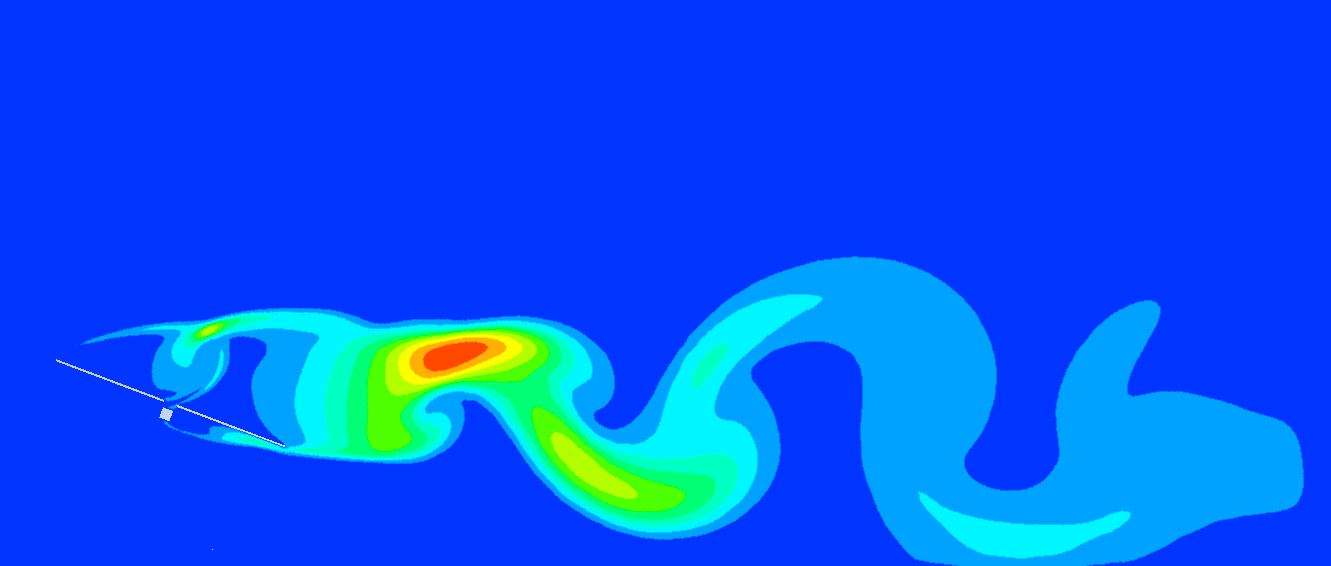
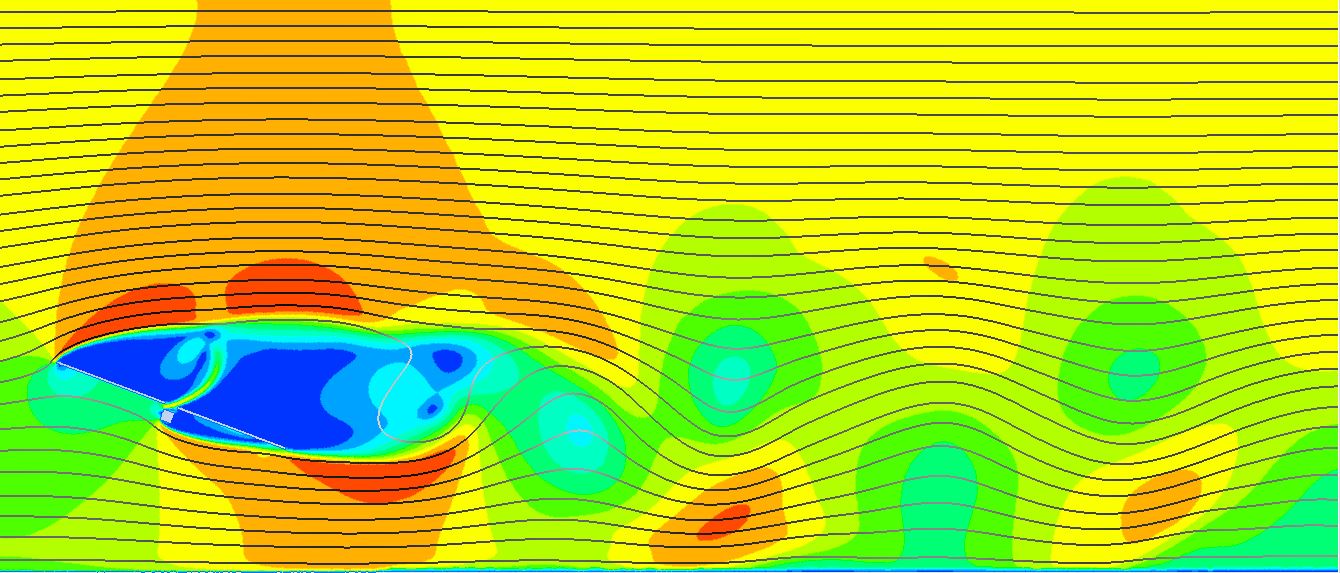
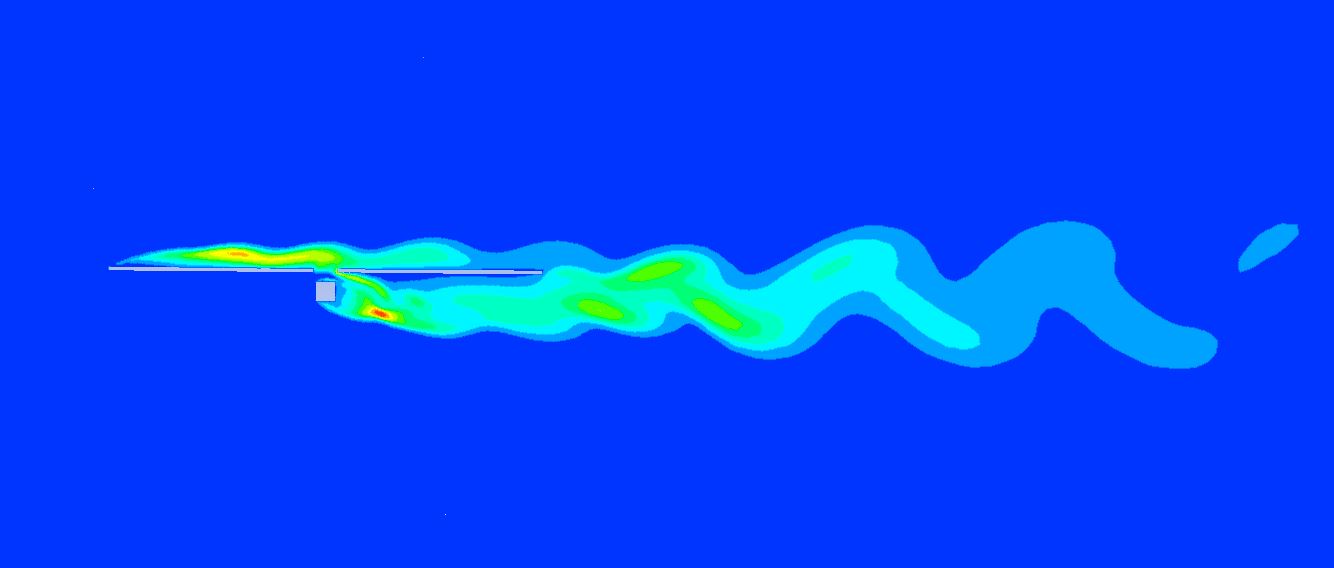
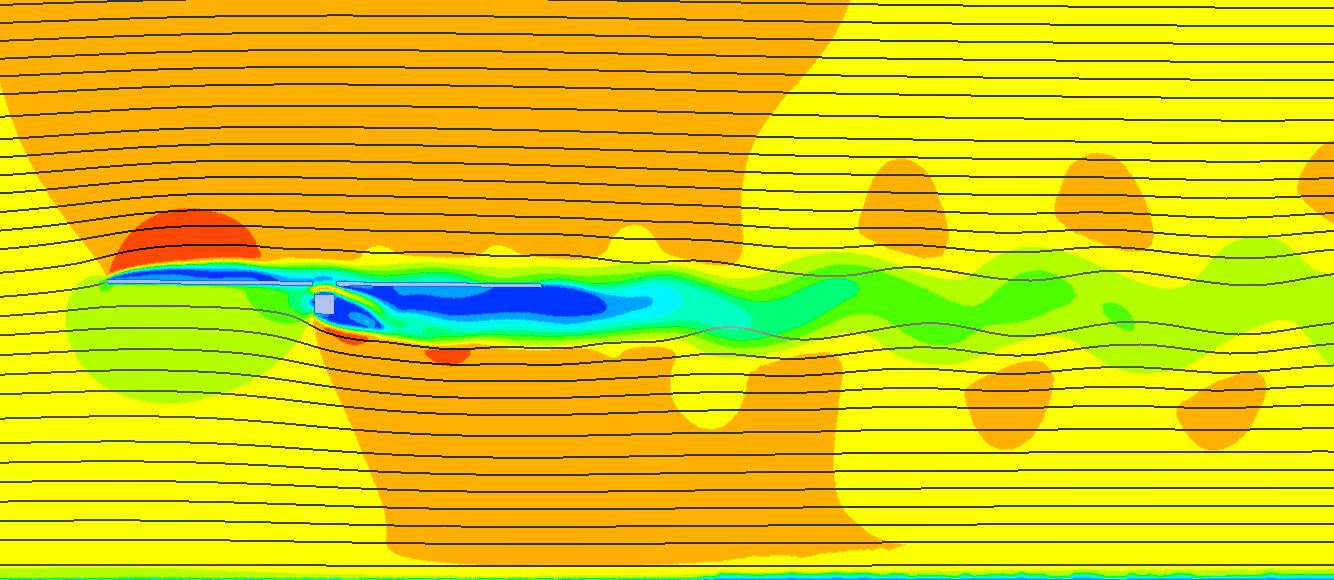
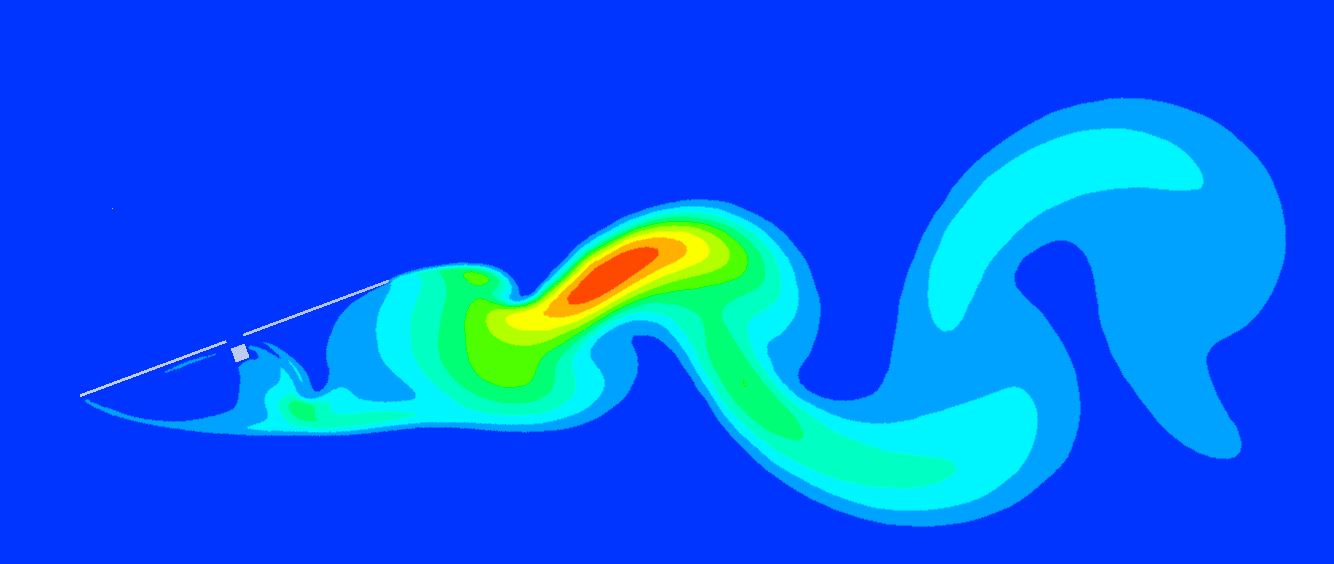
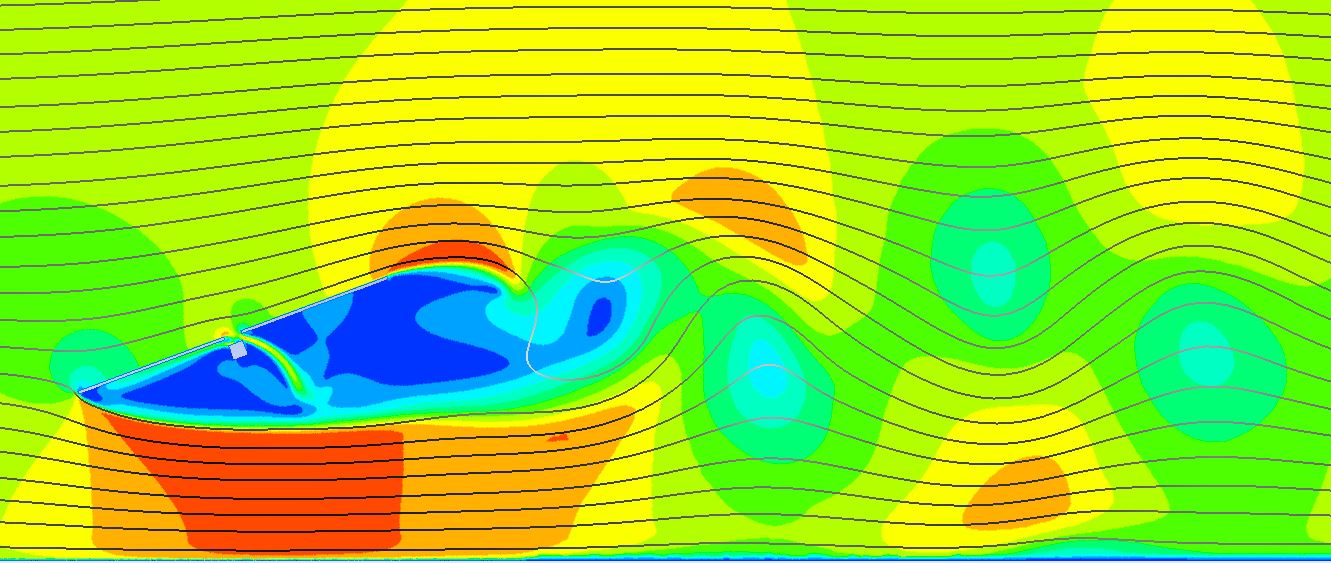
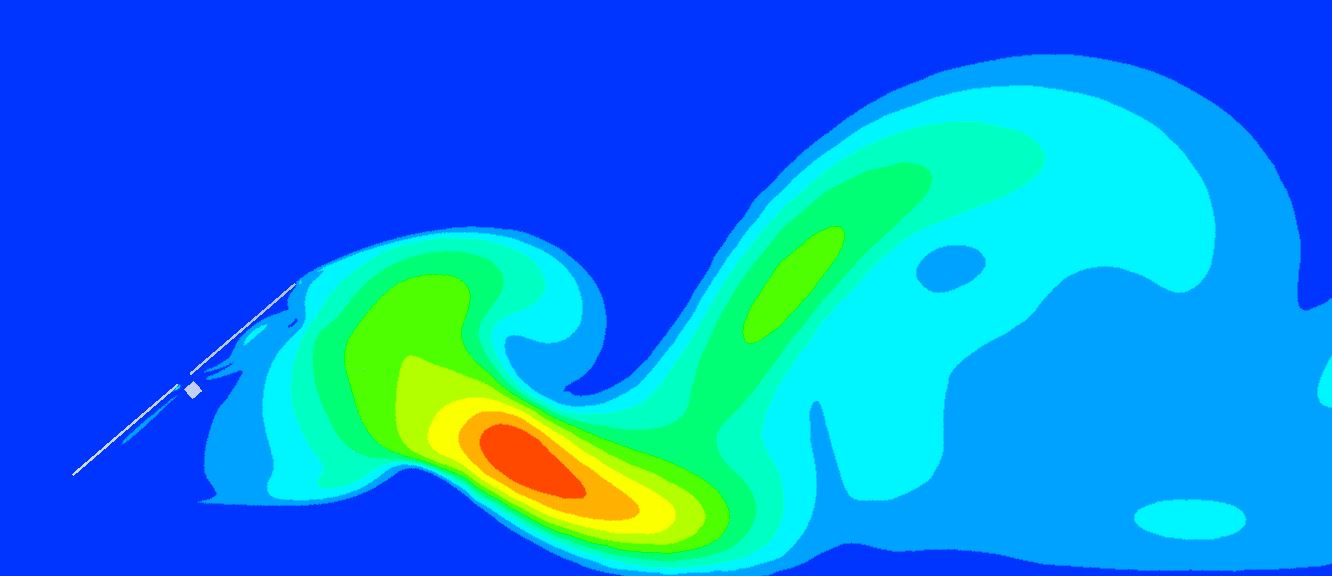
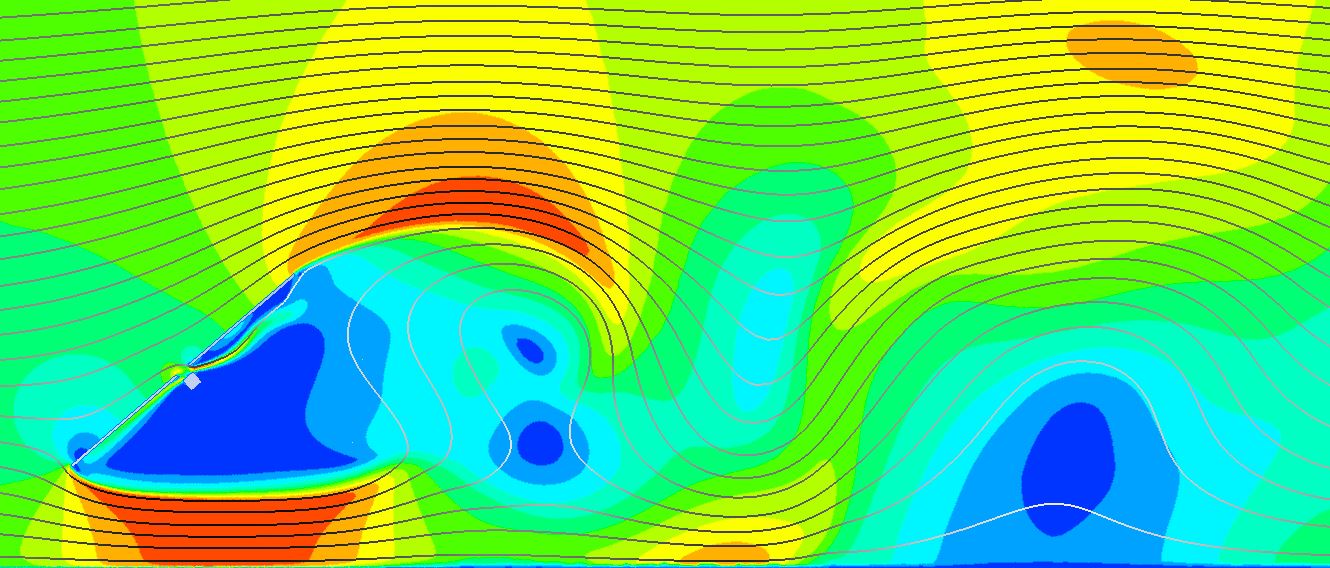
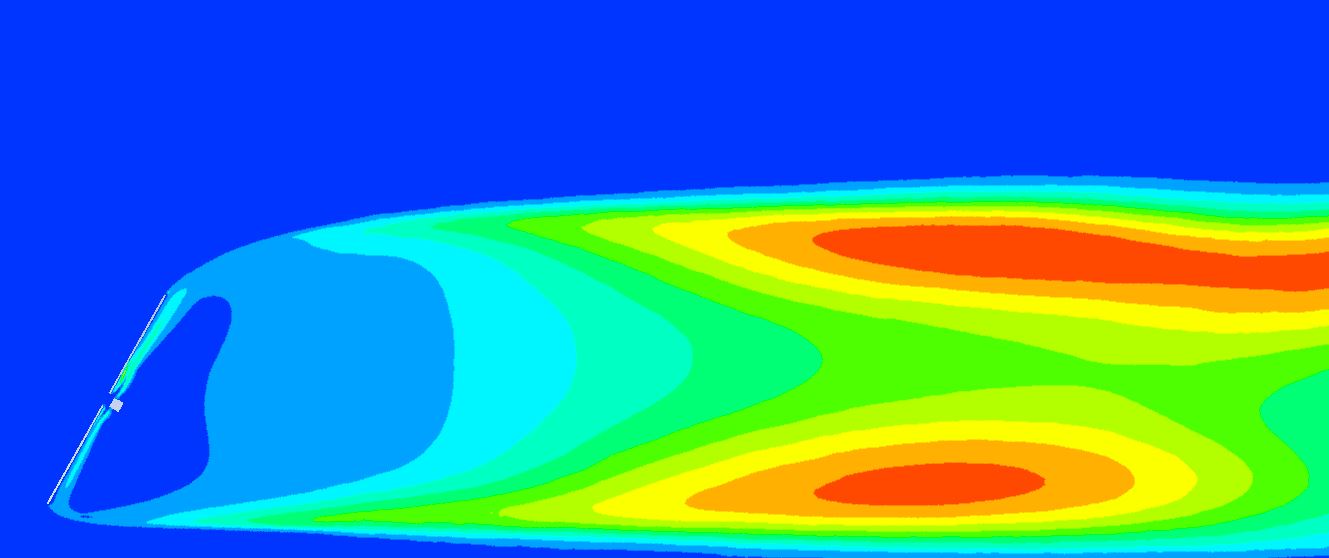
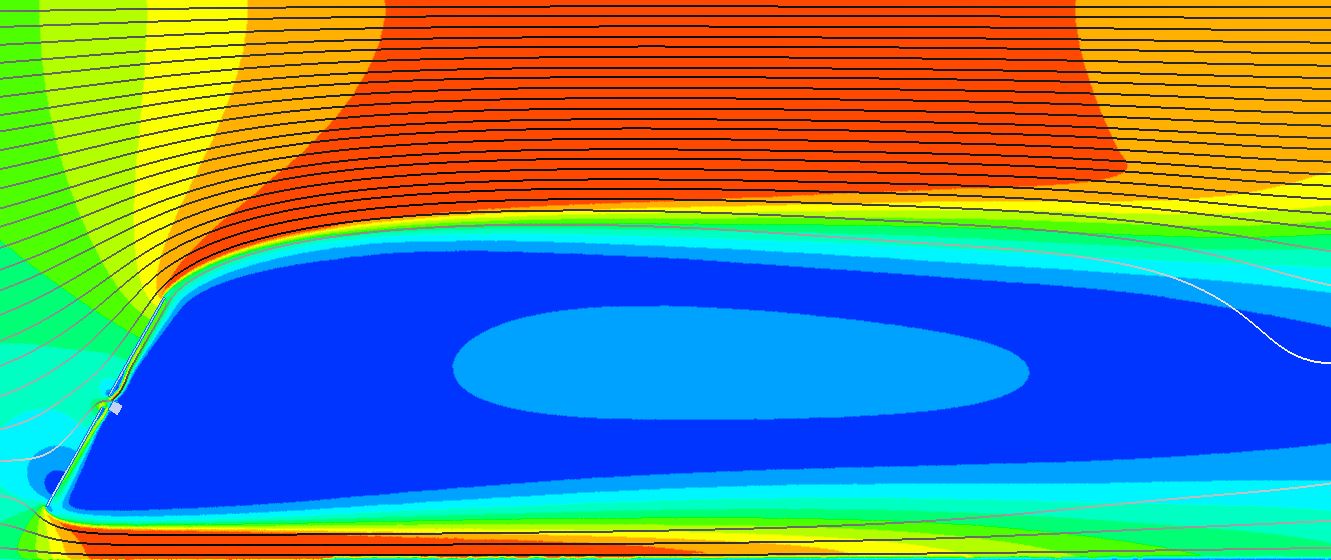
It is important to understand that, in aeroelastic solar tracker design, it must be supported the moments induced by leeward vortex shedding at any position at a wind speed equal to or less than the stow speed ( V_{1h, stow} = 10m/s ). Since the energy to move the tracker depends on the square of the velocity, stow speed will be the worst case for each tracker position.
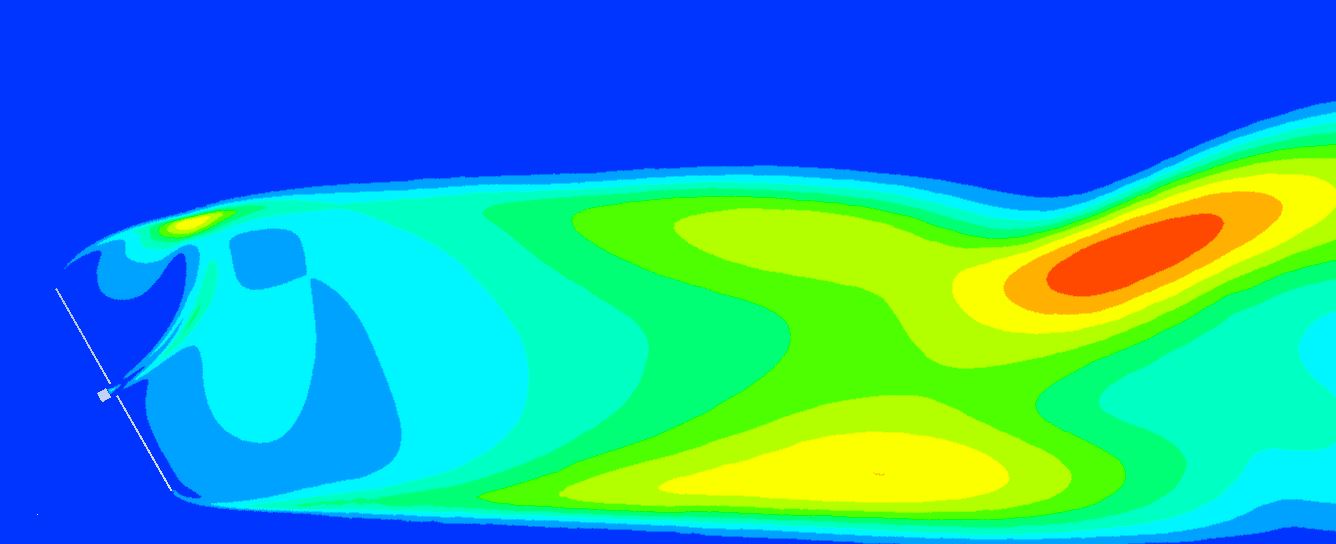
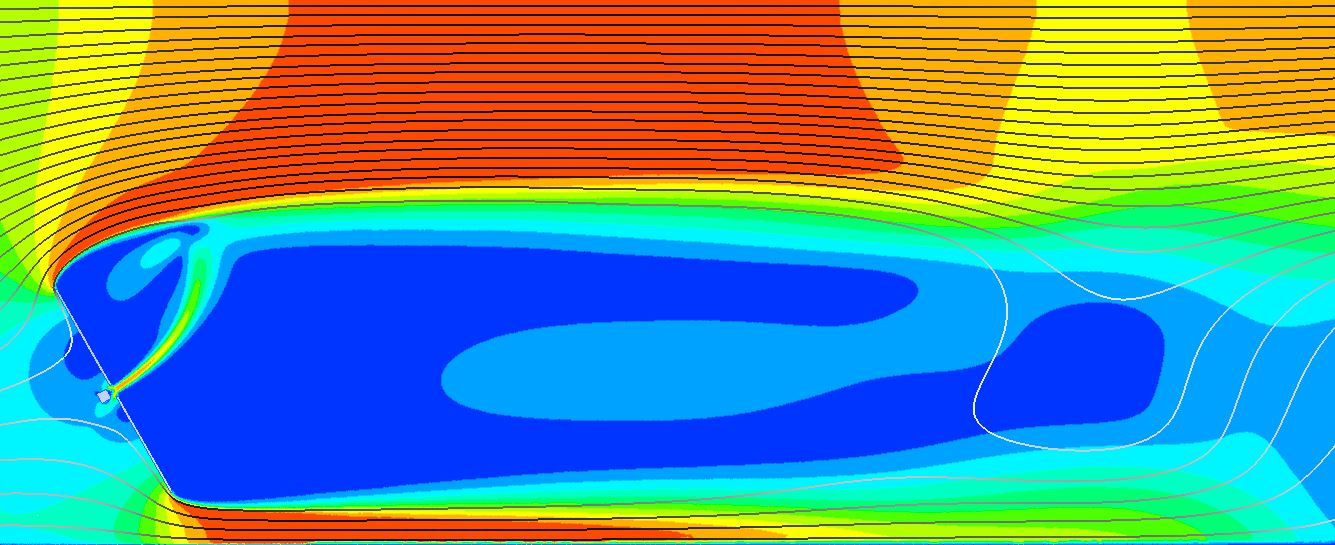
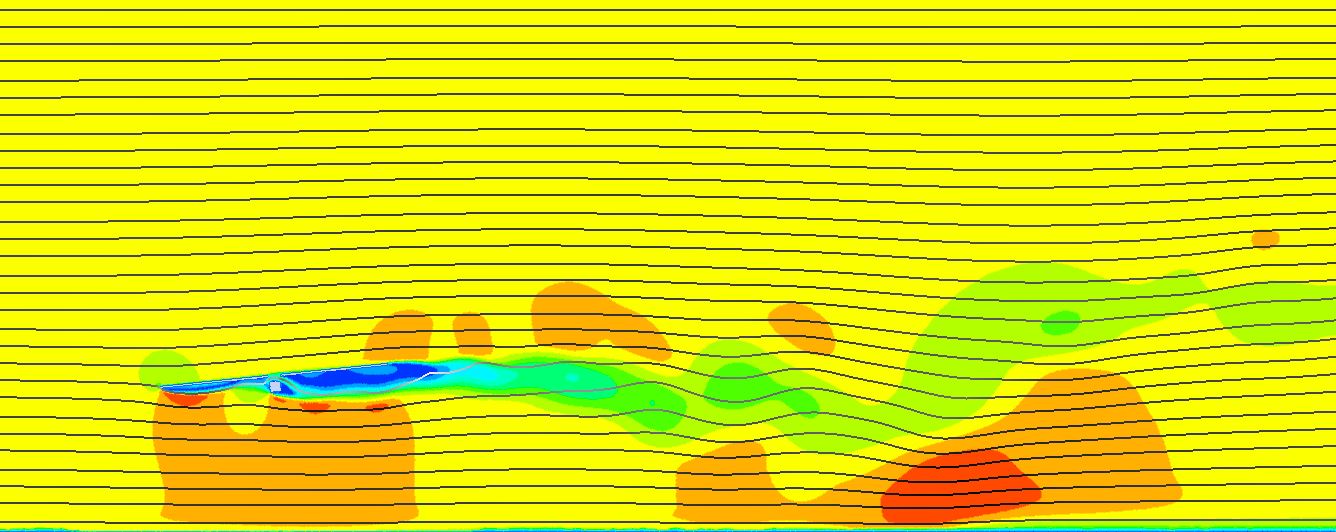
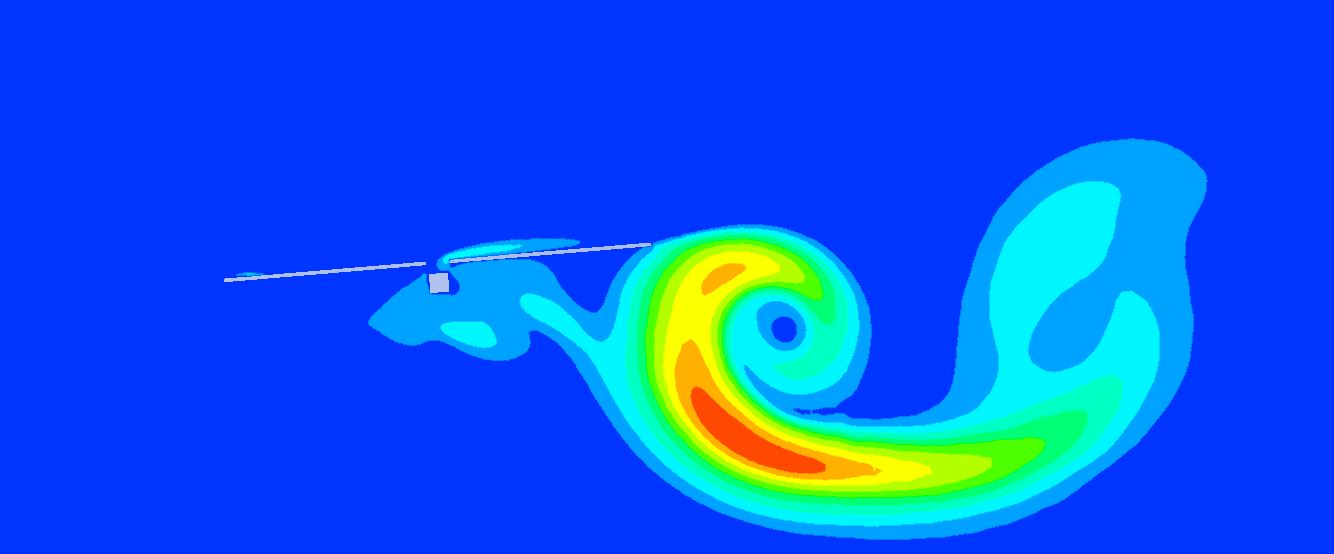
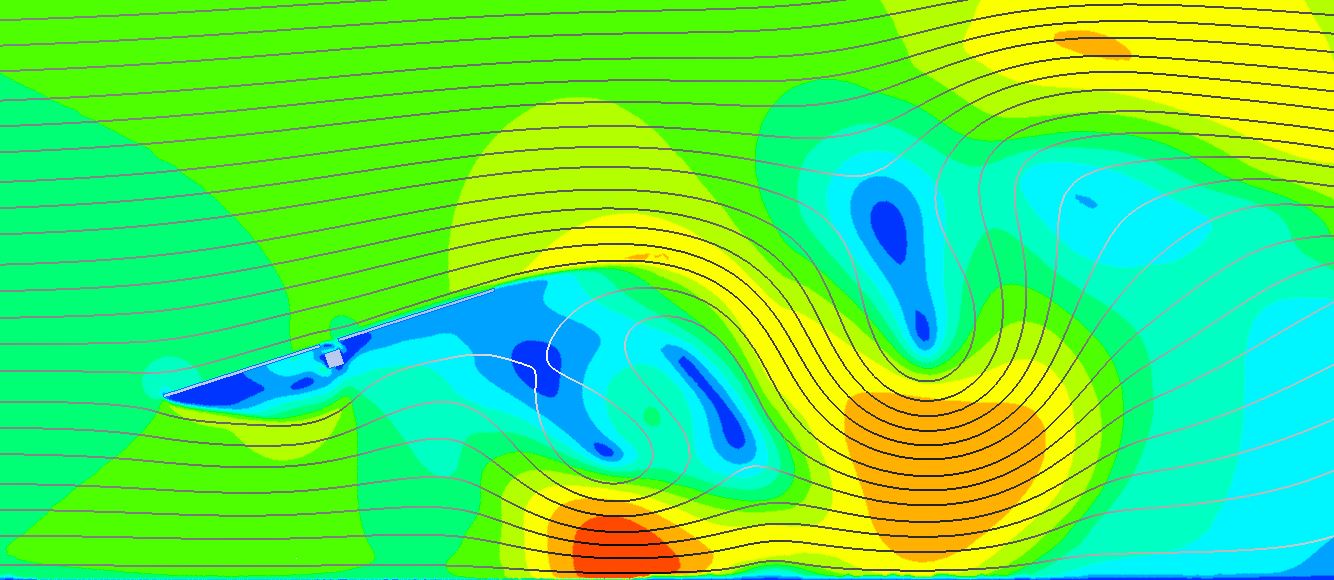
The vibrations obtained in the last tracker section for a wind speed of 10m/s, for 7 different operating tilts separated every 20º, are shown below.
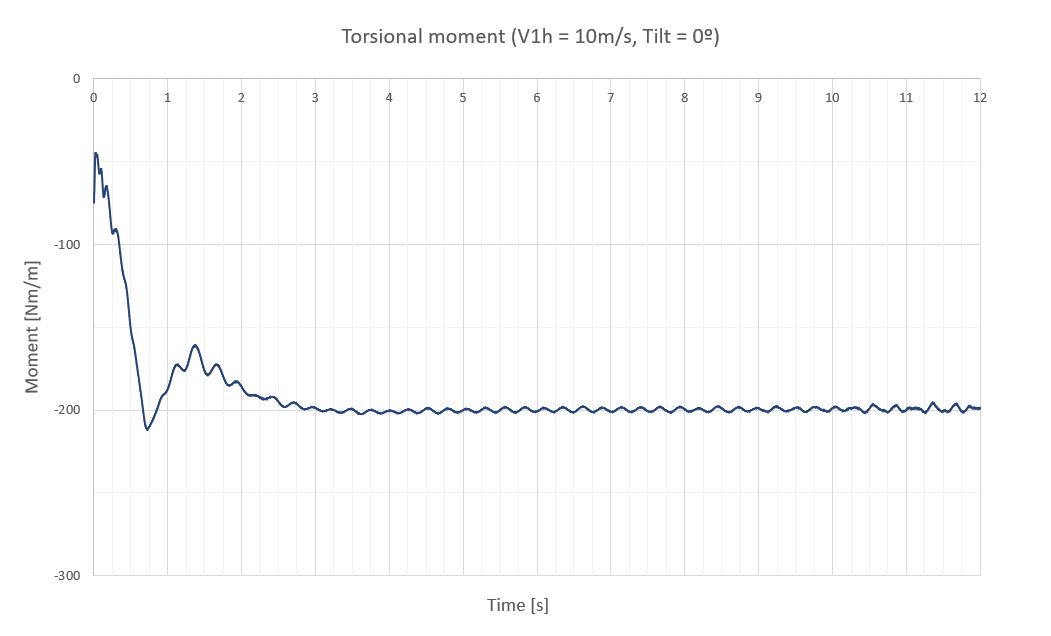
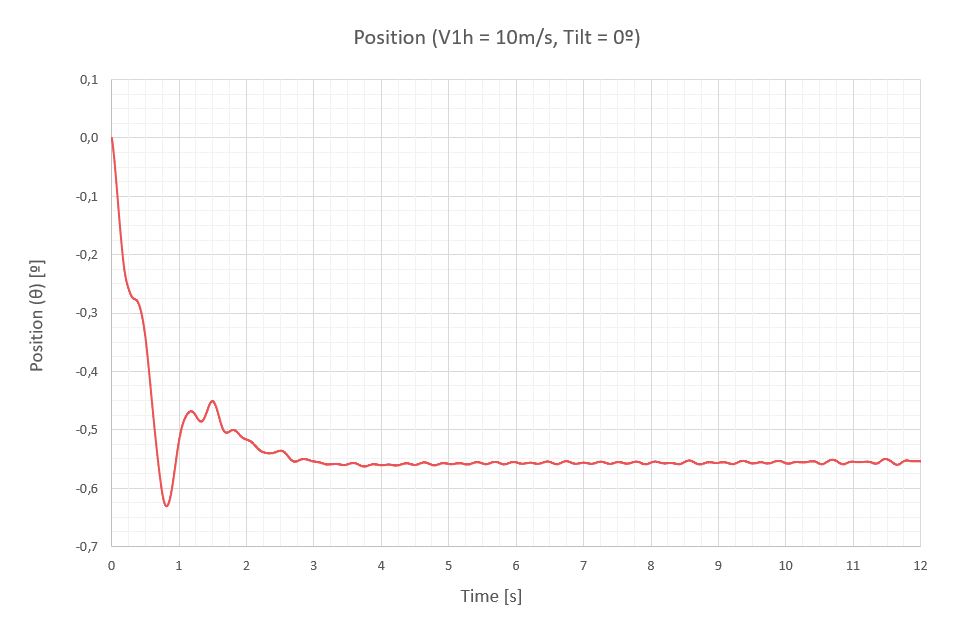
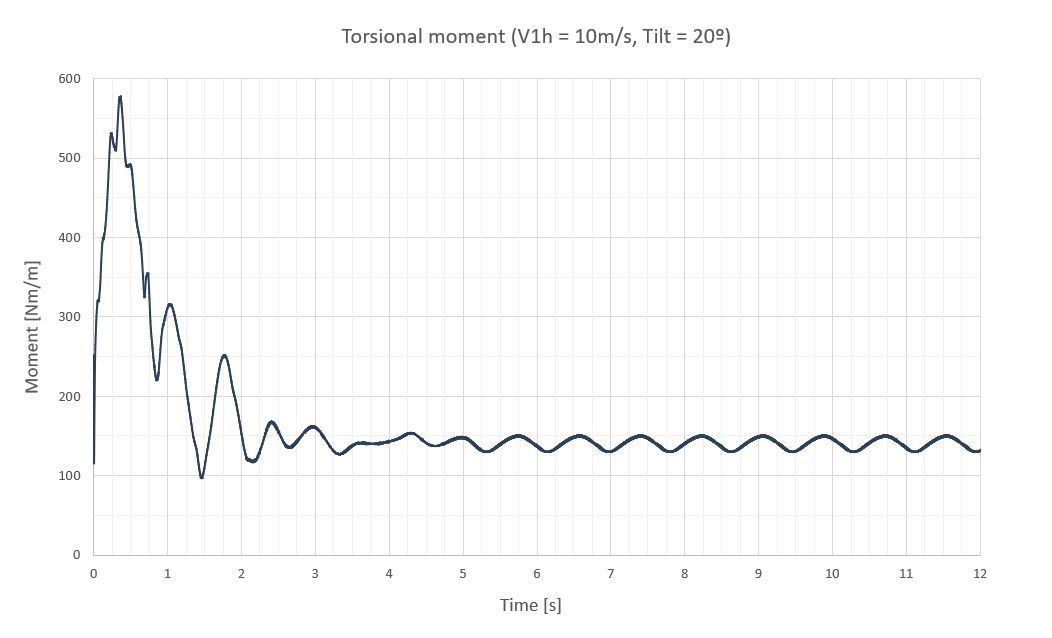
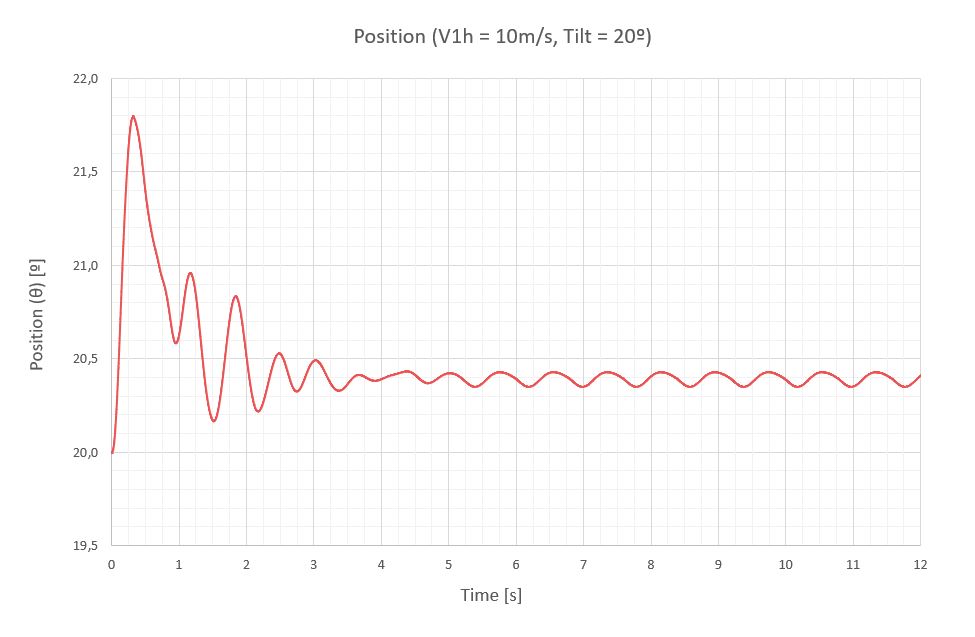
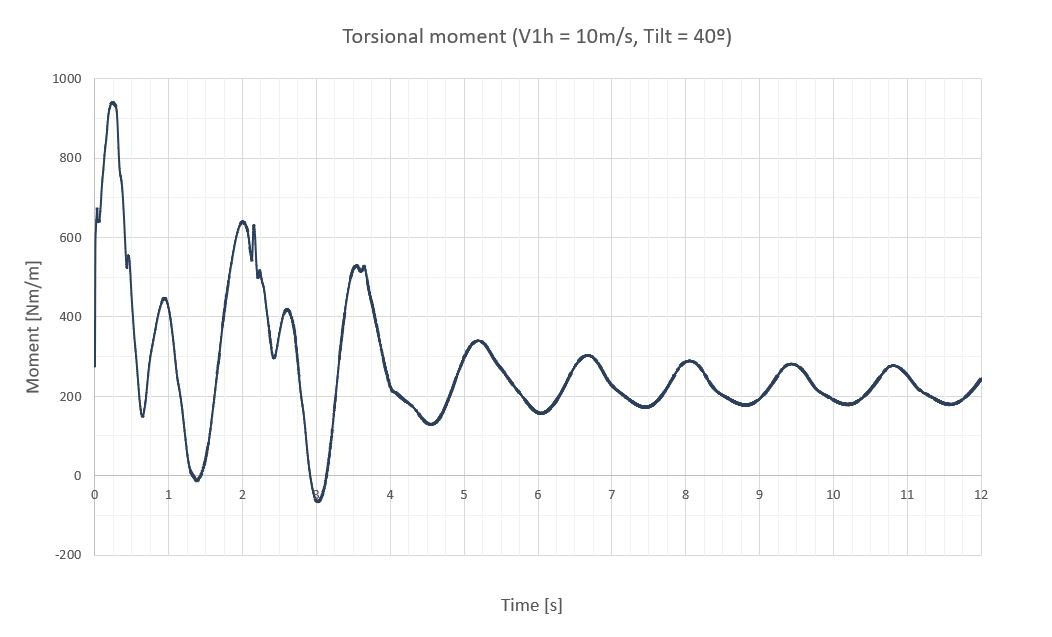
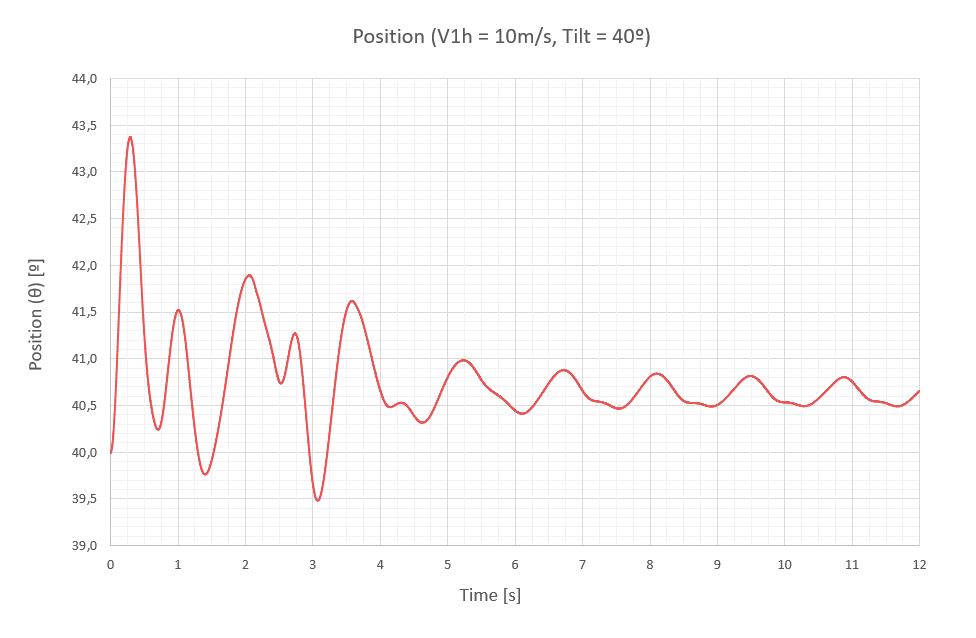
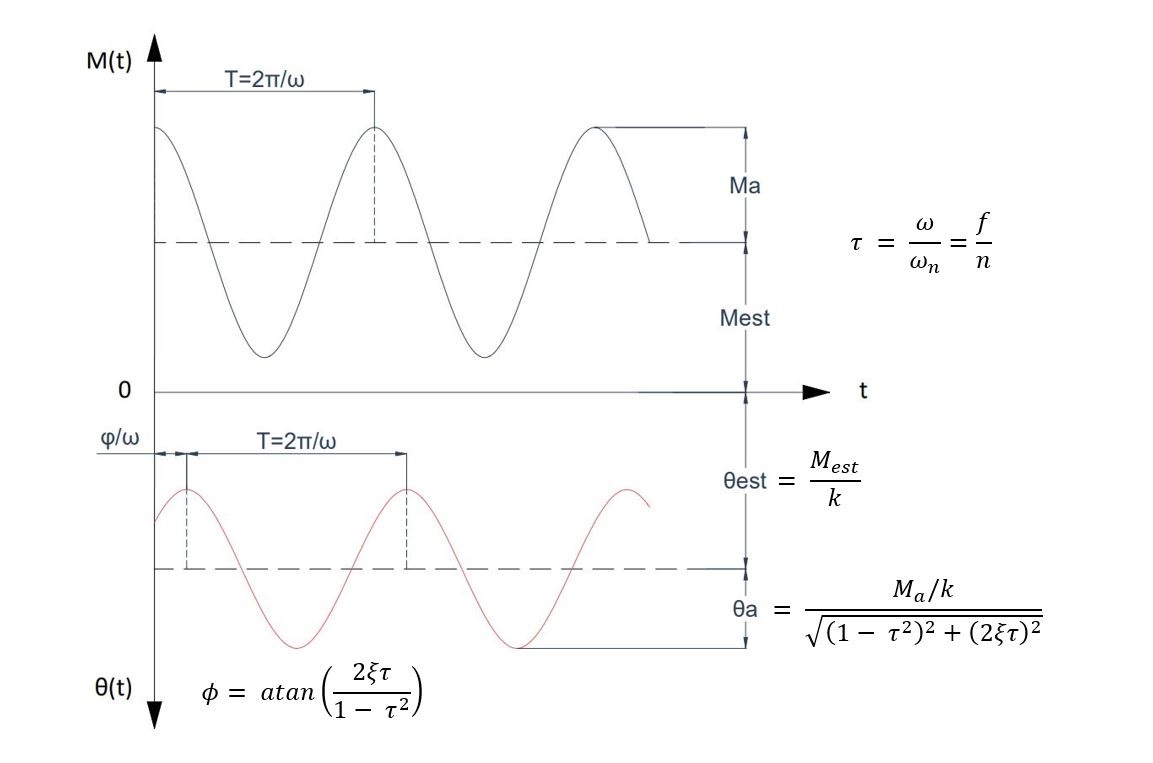
Below is a summary table showing the torsional moments (M) and the tracker response through the last section rotation (Δθ), which is measured with respect to the corresponding tracker tilt for comparison.
| Tilt [º] | T [s] | f [Hz] | Mest [Nm/m] | Ma [Nm/m] | Mmax [Nm/m] | Δθest [º] | Δθa [º] | Δθmax [º] |
|---|---|---|---|---|---|---|---|---|
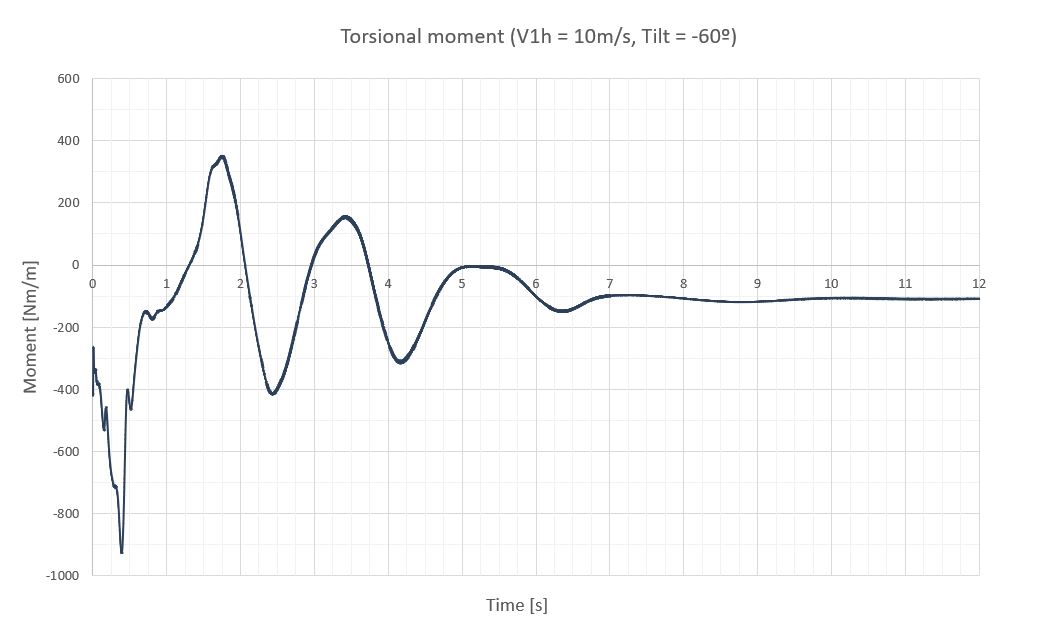
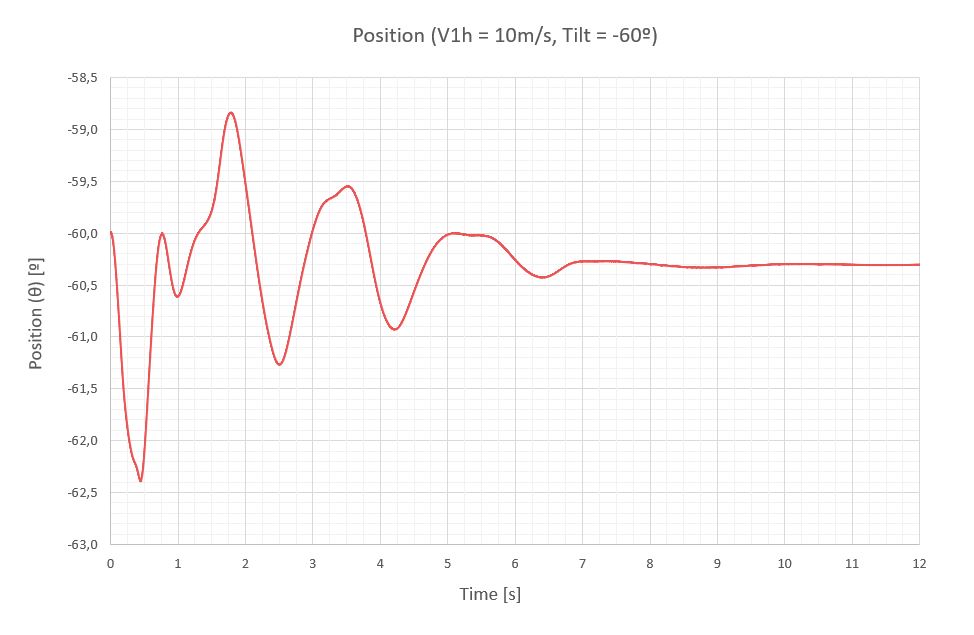
| -60 | 0 | 0 | -110 | 0 | -110 | -0.31 | 0 | -0.31 |
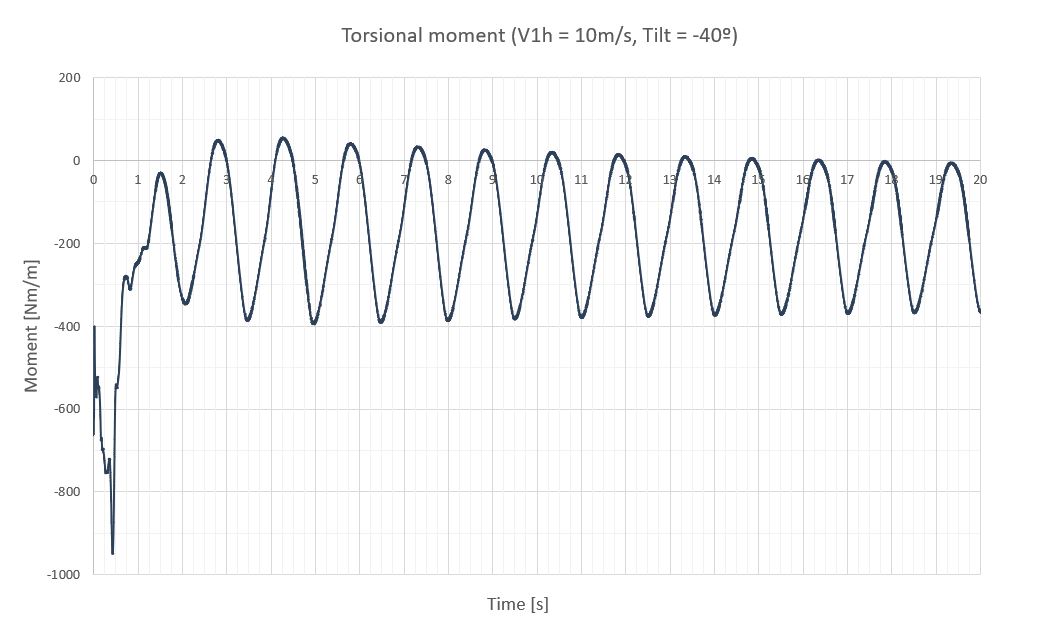
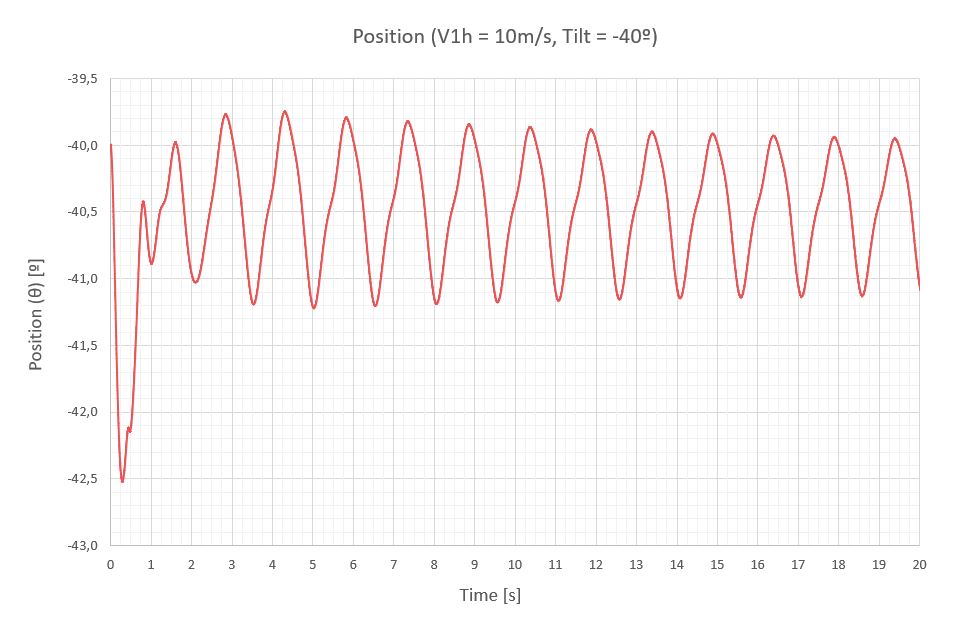
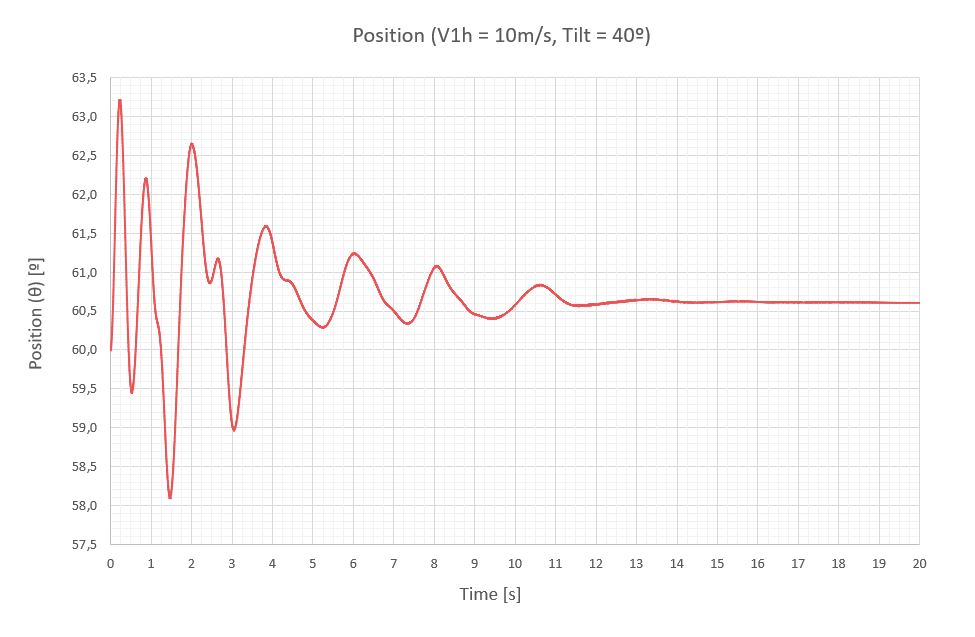
| -40 | 1.48 | 0.68 | -197 | ±169 | -366 | -0.55 | ±0.57 | -1.12 |
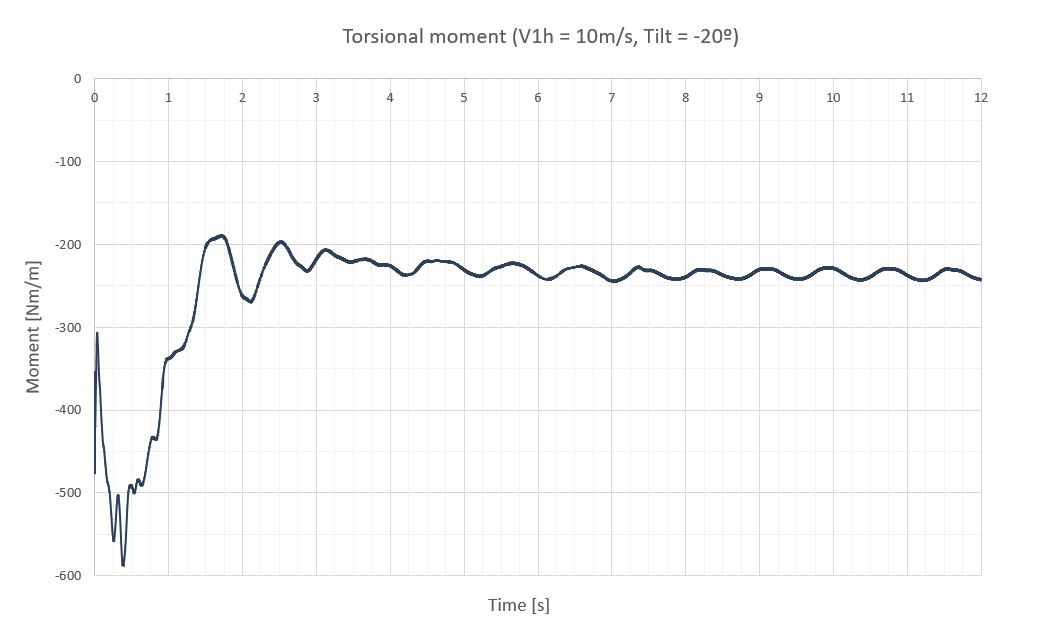
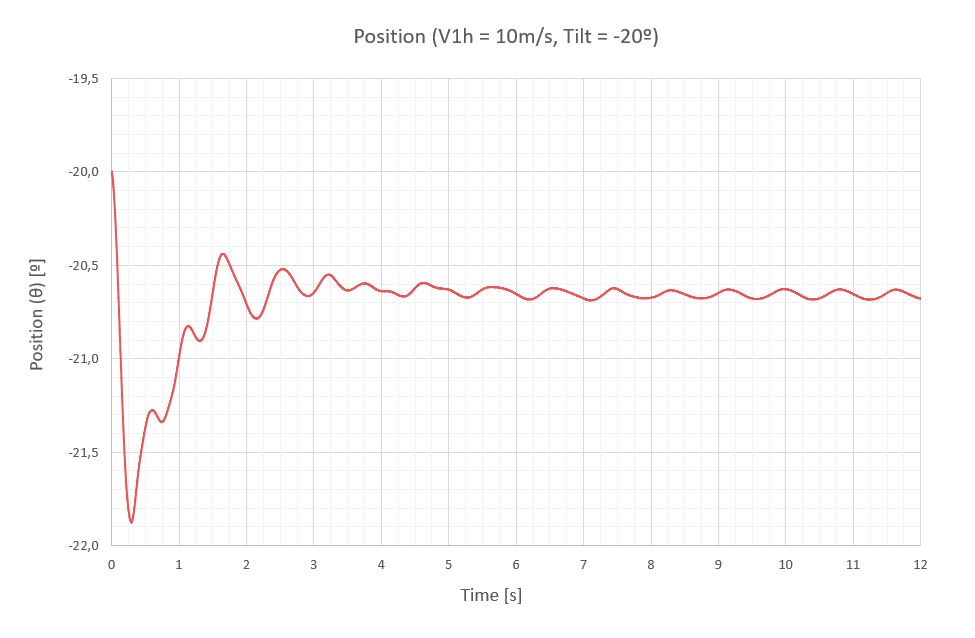
| -20 | 0.80 | 1.25 | -236 | ±7 | -243 | -0.66 | ±0.04 | -0.70 |
| 0 | 0 | 0 | -200 | 0 | -200 | -0.56 | 0 | -0.56 |
| 20 | 0.80 | 1.25 | 139 | ±8 | 147 | 0.39 | ±0.05 | 0.43 |
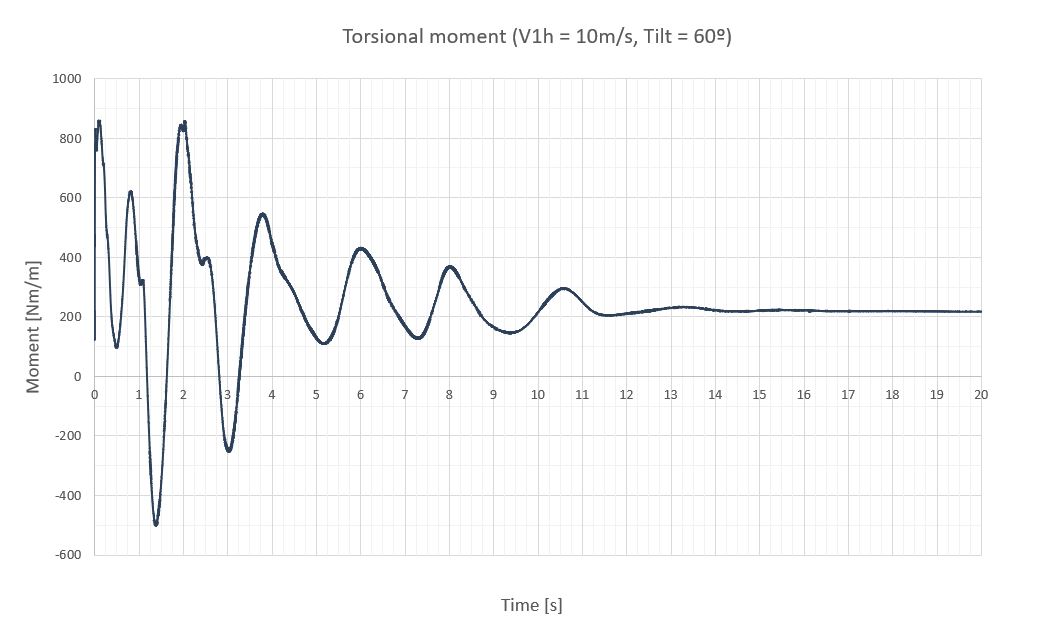
| 40 | 1.42 | 0.70 | 225 | ±46 | 271 | 0.63 | ±0.16 | 0.79 |
| 60 | 0 | 0 | 215 | 0 | 215 | 0.60 | 0 | 0.60 |
The following results are presented:
- The results calculated with the CFD software for aeroelastic solar tracker design coincide with the analytical ones described in our vortex shedding post, where the incident moment and the section rotation are related through the two-dimensional dynamic equation of the tracker.
- Transients are longer for positive tilts than for negative ones. Although they may not show the reality exactly, since in the simulation the wind speed rises from 0 to 10m/s instantaneously, but in real life the wind does it gradually..
- Tracker vibrations at wind stow speed in the steady state can be considered quasi-stationary, since the wind does not have enough energy to maintain a significant oscillation. The largest twists of the last section are detected at 40º of tilt and do not exceed 1.12º. This stable performance is largely due to the stiffness (k) and damping coefficient (ξ) defined to avoid torsional galloping and torsional divergence.
- It is observed that, for the tilt 20º, the maximum moments and tracker rotation are lower than in the horizontal position, which could lead us to think that it is a more stable position. In fact, it is for low wind speeds, which would lead us to choose it as the stow position. Nothing could be further from the truth. While the 20º tilt is more stable than the horizontal position for operating wind speeds ( V_{1h} \small < 10m/s ), it is not for plant survival speeds ( V_{1h} \small = 30m/s ) as will be seen in the following subsections.
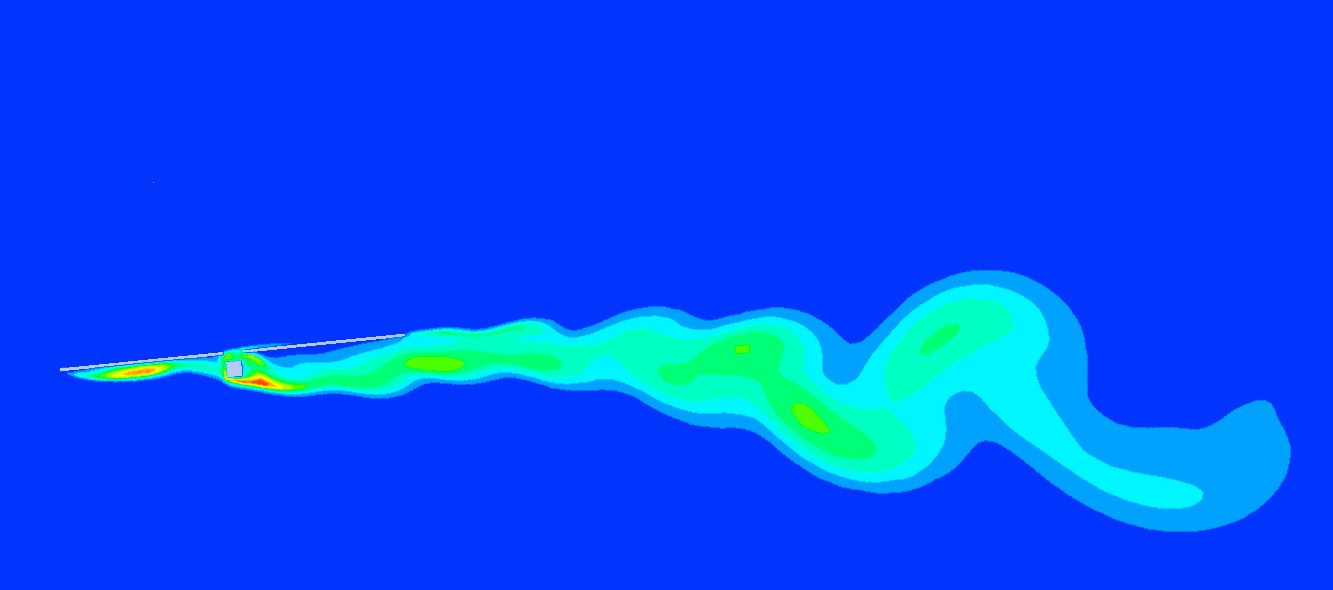
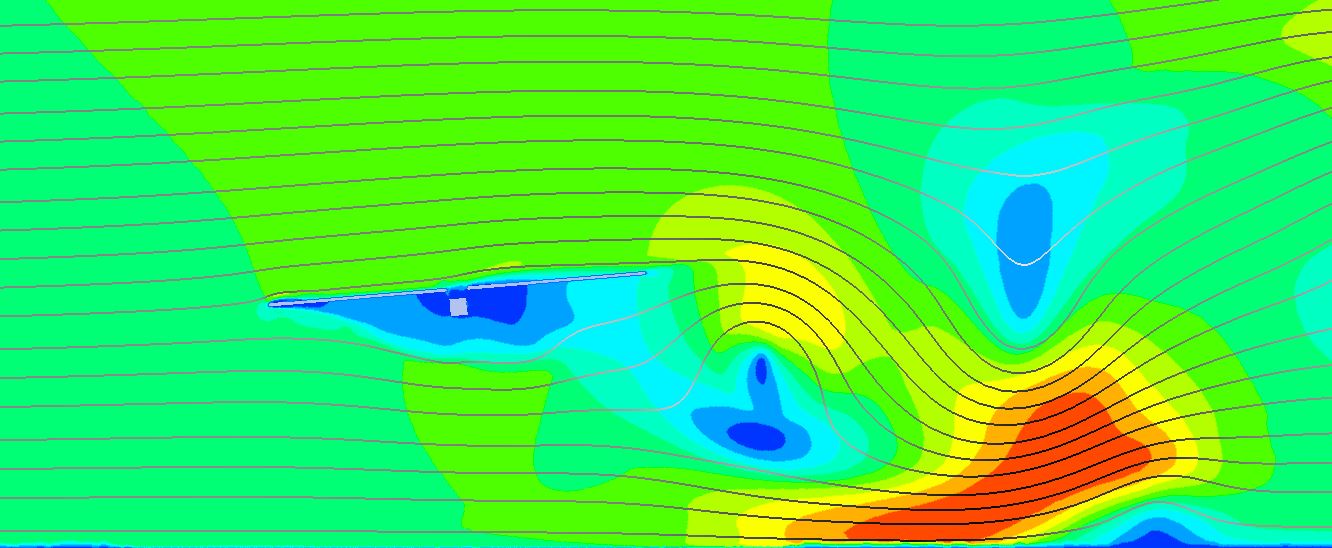
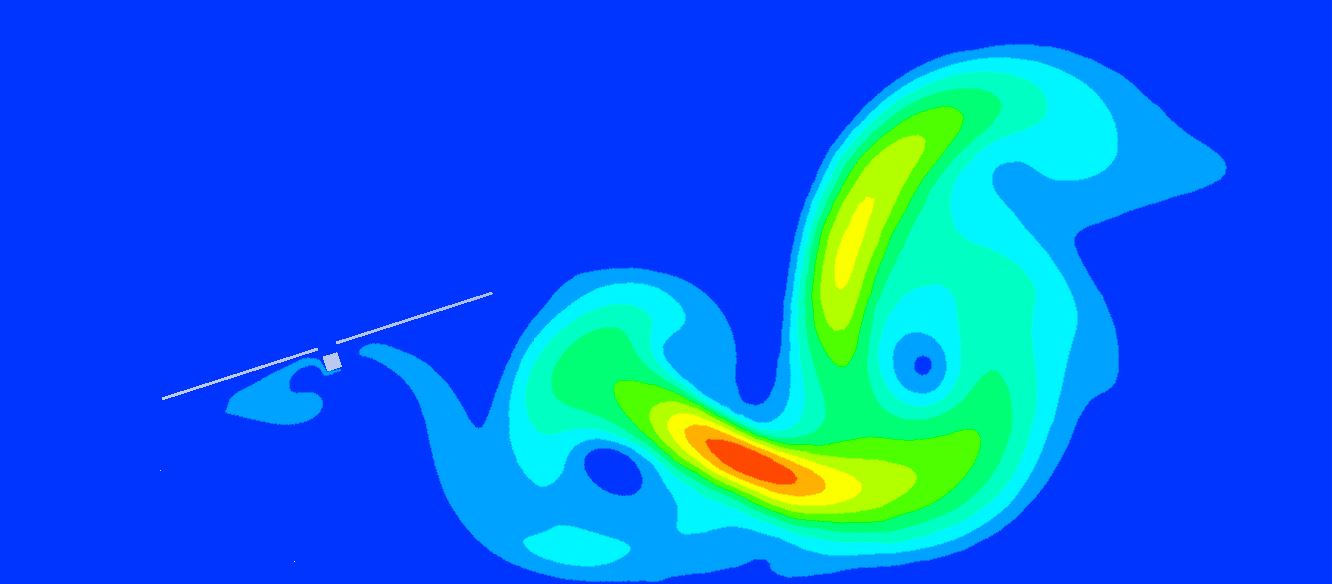
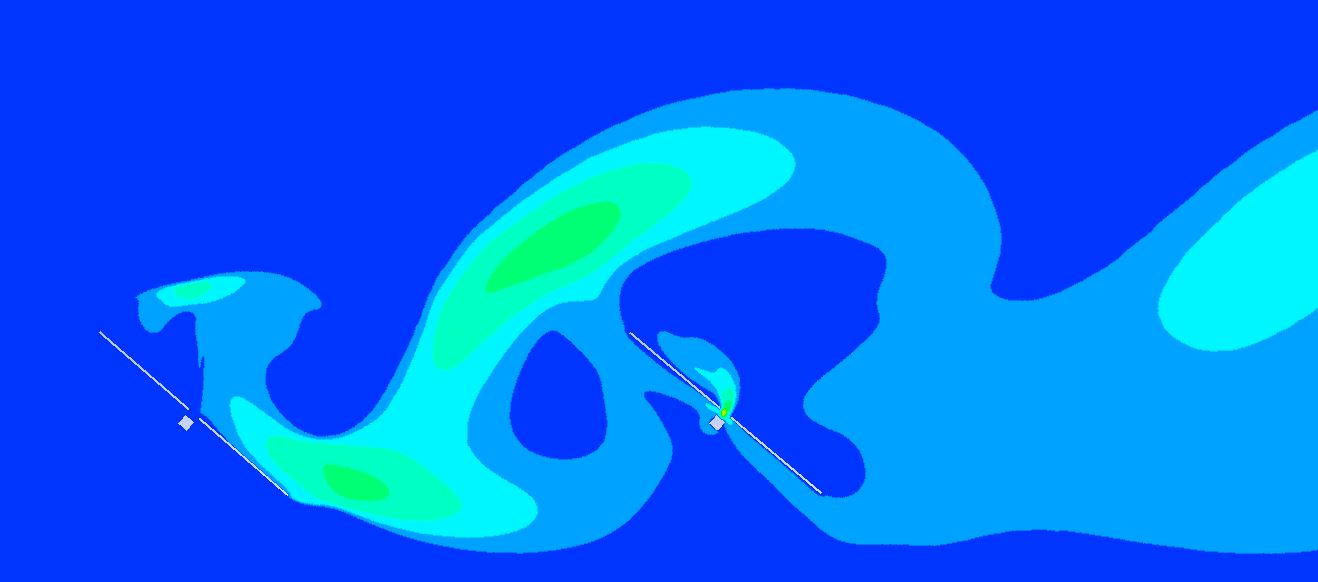
The stow position chosen for the trackers must withstand the moments induced by the vortex shedding of the plant survival wind speed ( V_{surv,1h} \small = 30m/s ). Since at this speed the wind has a high energy, the rotation of the tracker last section will be large, so it will enter into an oscillation of considerable amplitude, producing significant moments at the junction between the torque tube and the drive system. Since the torque tube is the structural element that supports these oscillating moments, it must be ensured that the yield limit is not exceeded.
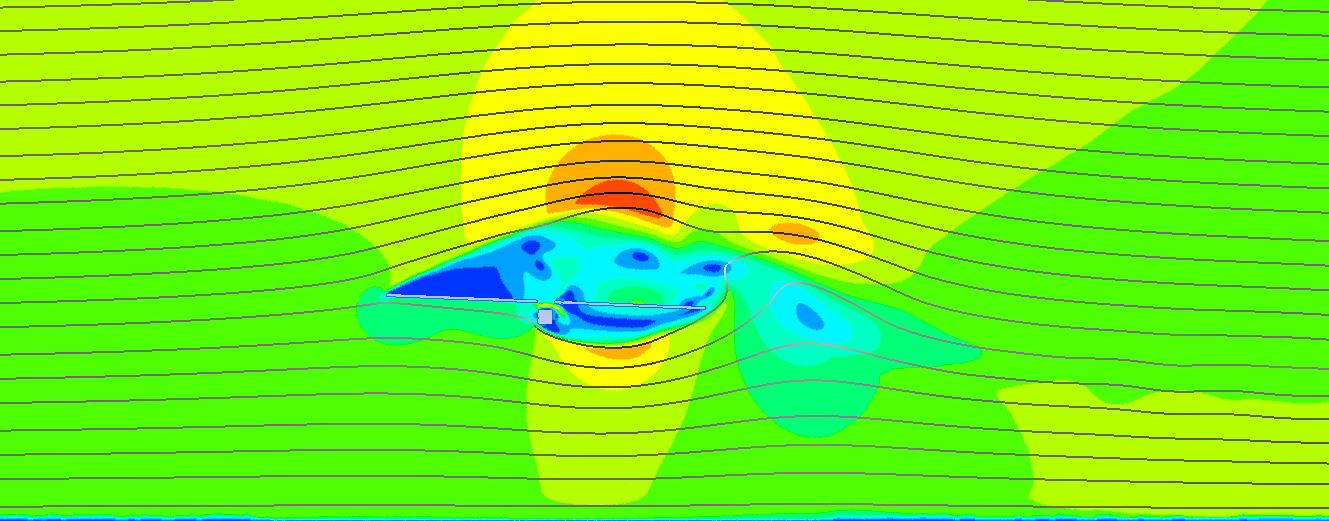
The study of the different tracker positions for stow wind speed ( V_{stow, 1h} = 10m/s ) for aeroelastic solar tracker design showed the tilt of 20º as the one that produced the least oscillations on the tracker due to vortex shedding, so it could be the best stow position.
It was therefore necessary to verify that this position (20º) produced lower oscillating moments than the traditional defense position of 0º at the plant survival wind speed ( V_{surv, 1h} = 30m/s ). Our aeroelastic studies confirm that this is not the case because the wind energy is much higher and the exposed surface of the 20º tilt is decisive for the production of very high moments that lead to the collapse of both the torque tube and the central drive system.
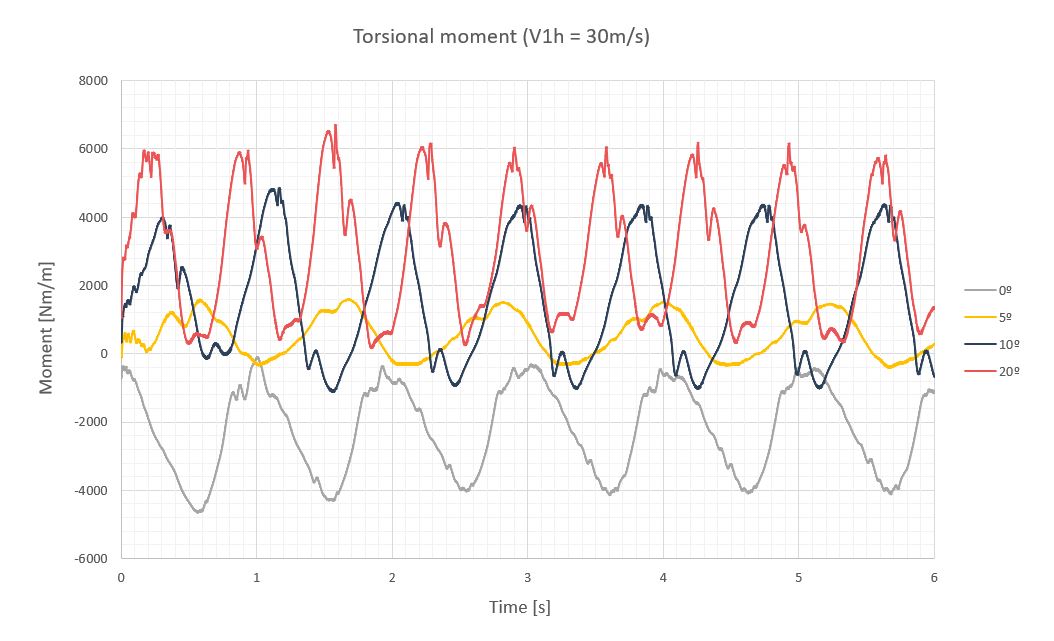
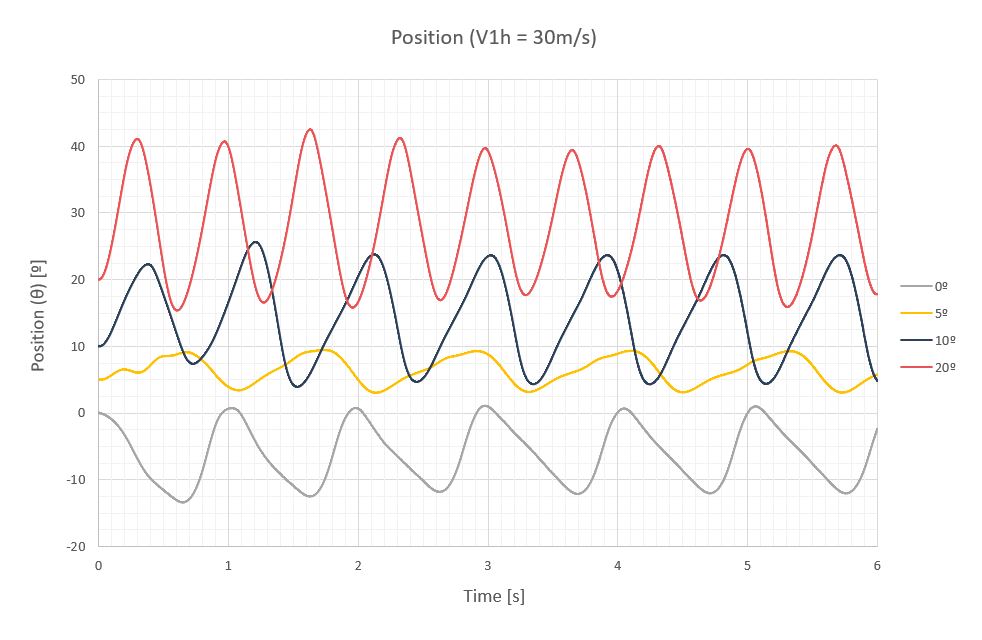
Since the moments produced at 0º were totally negative and those produced at 20º totally positive, it suggested that an intermediate position between both could provide lower oscillating moments. Studies on the 10º and 5º positions confirmed this supposition, where the 5º tilt appeared as the new stow position with maximum oscillating moments 75% lower with respect to the 20º tilt and 65% lower with respect to 0º. Also, the reduction of the last section twists is considerable going from -10 and 20º for the 0º and 20º tilts to only 4º. The following table shows these values.
| Tilt [º] | T [s] | f [Hz] | Mest [Nm/m] | Ma [Nm/m] | Mmax [Nm/m] | Δθest [º] | Δθa [º] | Δθmax [º] |
|---|---|---|---|---|---|---|---|---|
| 0 | 1 | 1 | -2200 | ±1900 | -4100 | -6.13 | ±6.54 | -12.68 |
| 5 | 1.16 | 0.86 | 568 | ±883 | 1450 | 1.58 | ±2.87 | 4.45 |
| 10 | 0.9 | 1.11 | 1630 | ±2630 | 4260 | 4.54 | ±9.55 | 14.10 |
| 20 | 0,69 | 1.45 | 3000 | ±3000 | 6000 | 8.36 | ±13.00 | 21.69 |
If we compare these graphs with the stow cases:
- Steady state is reached faster at high wind speeds.
- The wind has enough energy to twist the tracker significantly, so the moments produced must be checked for the calculation of the torque tube and the drive system limits.
Buffeting
There is a fourth phenomenon called buffeting that must be considered in aeroelastic solar tracker design, as it introduces instantaneous increases of load on vortex shedding.
Buffeting is due to changes in wind pressure on the structure because of turbulence. This causes the wind speed to oscillate around an average speed ( V_{1h} ), reaching positive peaks ( V_{3s} ) and negative peaks around this average speed, giving rise to speeds to be considered in the building codes.
This aeroelastic phenomenon introduces instantaneous pressure increases on the structure. As mentioned above, the maximum ratio between these speeds is 1.52 but at each point on the structure there will be a value between -1.52 and 1.52 at random. What can be confirmed is that, if there is a defined configuration of pressure points on the tracker surface at a given instant, this same configuration can be repeated randomly over time.
Technical codes consider this peak speed for all structure sections, but in reality, and due to the length of the tracker, they only occur in certain areas and never at the same time over the entire surface. That is why building standards are always on the safety side and that is why wind tunnel tests better adjust the real load on structures by considering only the maximum configurations of these peak pressures that occur in real situations.
In our post Buffeting on solar trackers we define an average gust value ( \bar G ) to be used to increase the torsional moments due to this phenomenon.
\bar G = \Large \frac{1 + 1.52}{2} \normalsize = 1.26
This parameter that increases wind loads due to turbulence should not be applied to tracker rows that are totally immersed in the wake of contiguous trackers, as occurs in the more vertical tracker tilts [-60º, 40º] and [40º, 60º], since they will never see such turbulence, only the wake of the adjacent tracker.
In contrast, wake buffeting affects only internal trackers in the plant and is an instability due to pressure changes in the wind that causes the vortex shedding from a structure that is between the wind flow and the design structure. It is therefore a second resonance problem, since if the vortex shedding causes an oscillation on the structure it leaves, it will also cause an oscillation on the next structure it hits, given that both structures are identical and have the same natural frequency.
As a result, a vibration of amplitude and frequency will appear, a priori, different from those of the tracker facing the totally clean wind flow, so each row of trackers should be checked to see if there are significant modifications with respect to the perimeter row that change the tracker design.
For practical purposes, the increase in torsional moments due to the wake buffeting on tracker inner rows with respect to the perimeter ones can be estimated as a 15%.
Mechanical components
To calculate the maximum tangential stresses due to torsional strength on the tube, we need the moments produced at the plant survival wind speed ( V_{surv,3s} = 45m/s ) at the stow position.
By means of CDF software, the static moment (Mest) and the oscillating one (Ma) have been calculated in previous paragraphs for the average velocity V_{surv,1h} = 30m/s and the stow position of 5º. The values we are looking for to calculate the torque tube should be considered with the peak wind speed at the vortex separation frequency (f), taking into account the load increase by buffeting ( \bar G ), when applicable.
Some indicative values for the first perimeter row of trackers are given below:
M_{est,V3s} = \bar G M_{est,V1h} = 900Nm/m
M_{a,V3s} = \bar G M_{a,V1h} = 1400Nm/m
M_{max} = M_{est} + M_a = 2300Nm/m
f = 0.86Hz
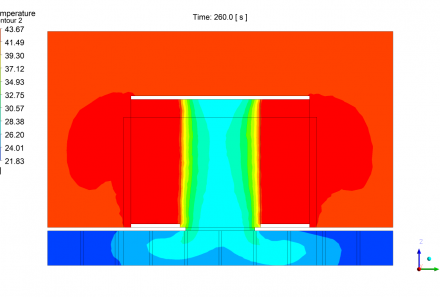
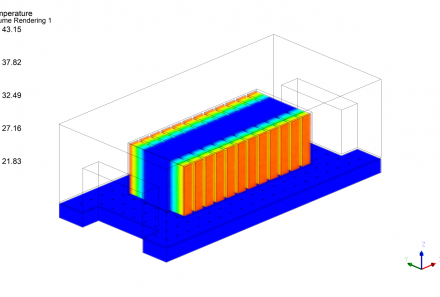
In order to obtain the stresses on the tube, these moments must be analyzed in a three-dimensional forced dynamic model, since the mode of vibration is also three-dimensional.
The maximum moments will appear at the junction of the torque tube with the flange that fastens the drive system. The graph of stresses in this area due to the moments and frequency of calculation is shown below:
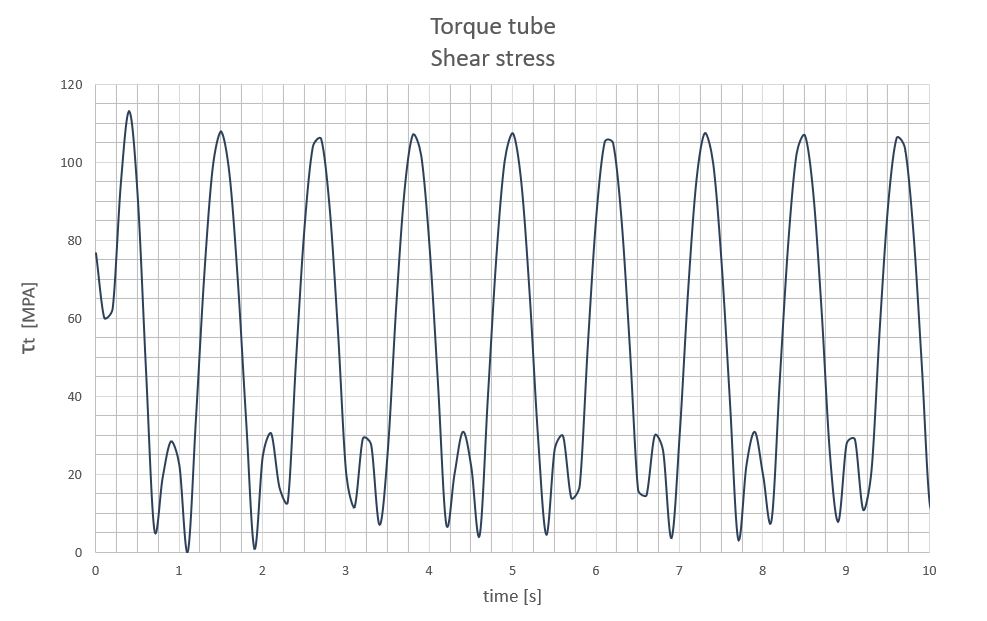
With this level of stresses, we can claim that the torque tube does not collapse due to torsional shear stresses. To these stresses should be added those produced by the wind forces of drag and lift, but since the level of tangential torsional stresses is below half of the material yield limit, there is a considerable gap to withstand these loads.
The design criteria of the drive system depending on the torsional moments are described in this post and summarized here. It should be taken into account that the central drive system always supports double the loads of a single torque tube.
The maximum moments for the drive system will be observed for stow position (5º) at the plant survival wind speed in the next cases:
- For stow position of 5º and peak survival wind speed ( Vsurv,3s = 45m/s ):
Holding torque > 2L · Mmax_{ Vsurv,3s} = 79600Nm
With:
\small Mmax_{ Vsurv,3s} = \bar G Mmax_{ Vsurv,1h}
- For any tracker tilt and peak stow wind speed V_{stow,3s} = 15m/s :
Maximum torque > 2L · Mmax _{ Vstow,3s} = 20100Nm
With:
\small Mmax_{ Vstow,3s} = \bar G Mmax_{ Vstow,1h}
- For any tracker tilt and average stow wind speed V_{stow,1h} = 10m/s :
Nominal torque > 2L · Mmax_{ Vstow,1h} = 12660Nm
Where L is the length of each torque tube and \bar G is the factor that increases the load due to buffeting turbulence.
If these three conditions are not met, a drive system with higher torsional limits should be installed, to increase the stiffness (k) and damping (ξ) of the system or, if necessary, to shorten the tracker length, in order to reduce the incident moments on the tracker caused by vortex shedding.
Fatigue is a mechanical phenomenon that leads to material collapse due to repetitive loads of lower value than those that would cause material plastic behavior in static cases.
In single-axis solar trackers, fatigue can appear at the junction of the torque tube with the drive system, specifically in the flange welding to the torque tube, due to notches and small imperfections in the weld, which causes areas of micro-cracks that grow over time due to the oscillating load.
From the above results, if the tracker is designed with the stiffness (k) and damping (ξ) to meet the divergence and galloping criteria, the moments produced by wind vortex shedding for speeds equal to or less than the stow ones do not seem to have amplitudes too high in steady state to exceed the material fatigue limit.
Related posts
Projects


About us